See your data across
space and time.
Explore linked maps, tracks, charts and tables,
with analysis calculated locally.
A desktop data-exploration project. This page is a visual showcase, not the live application.
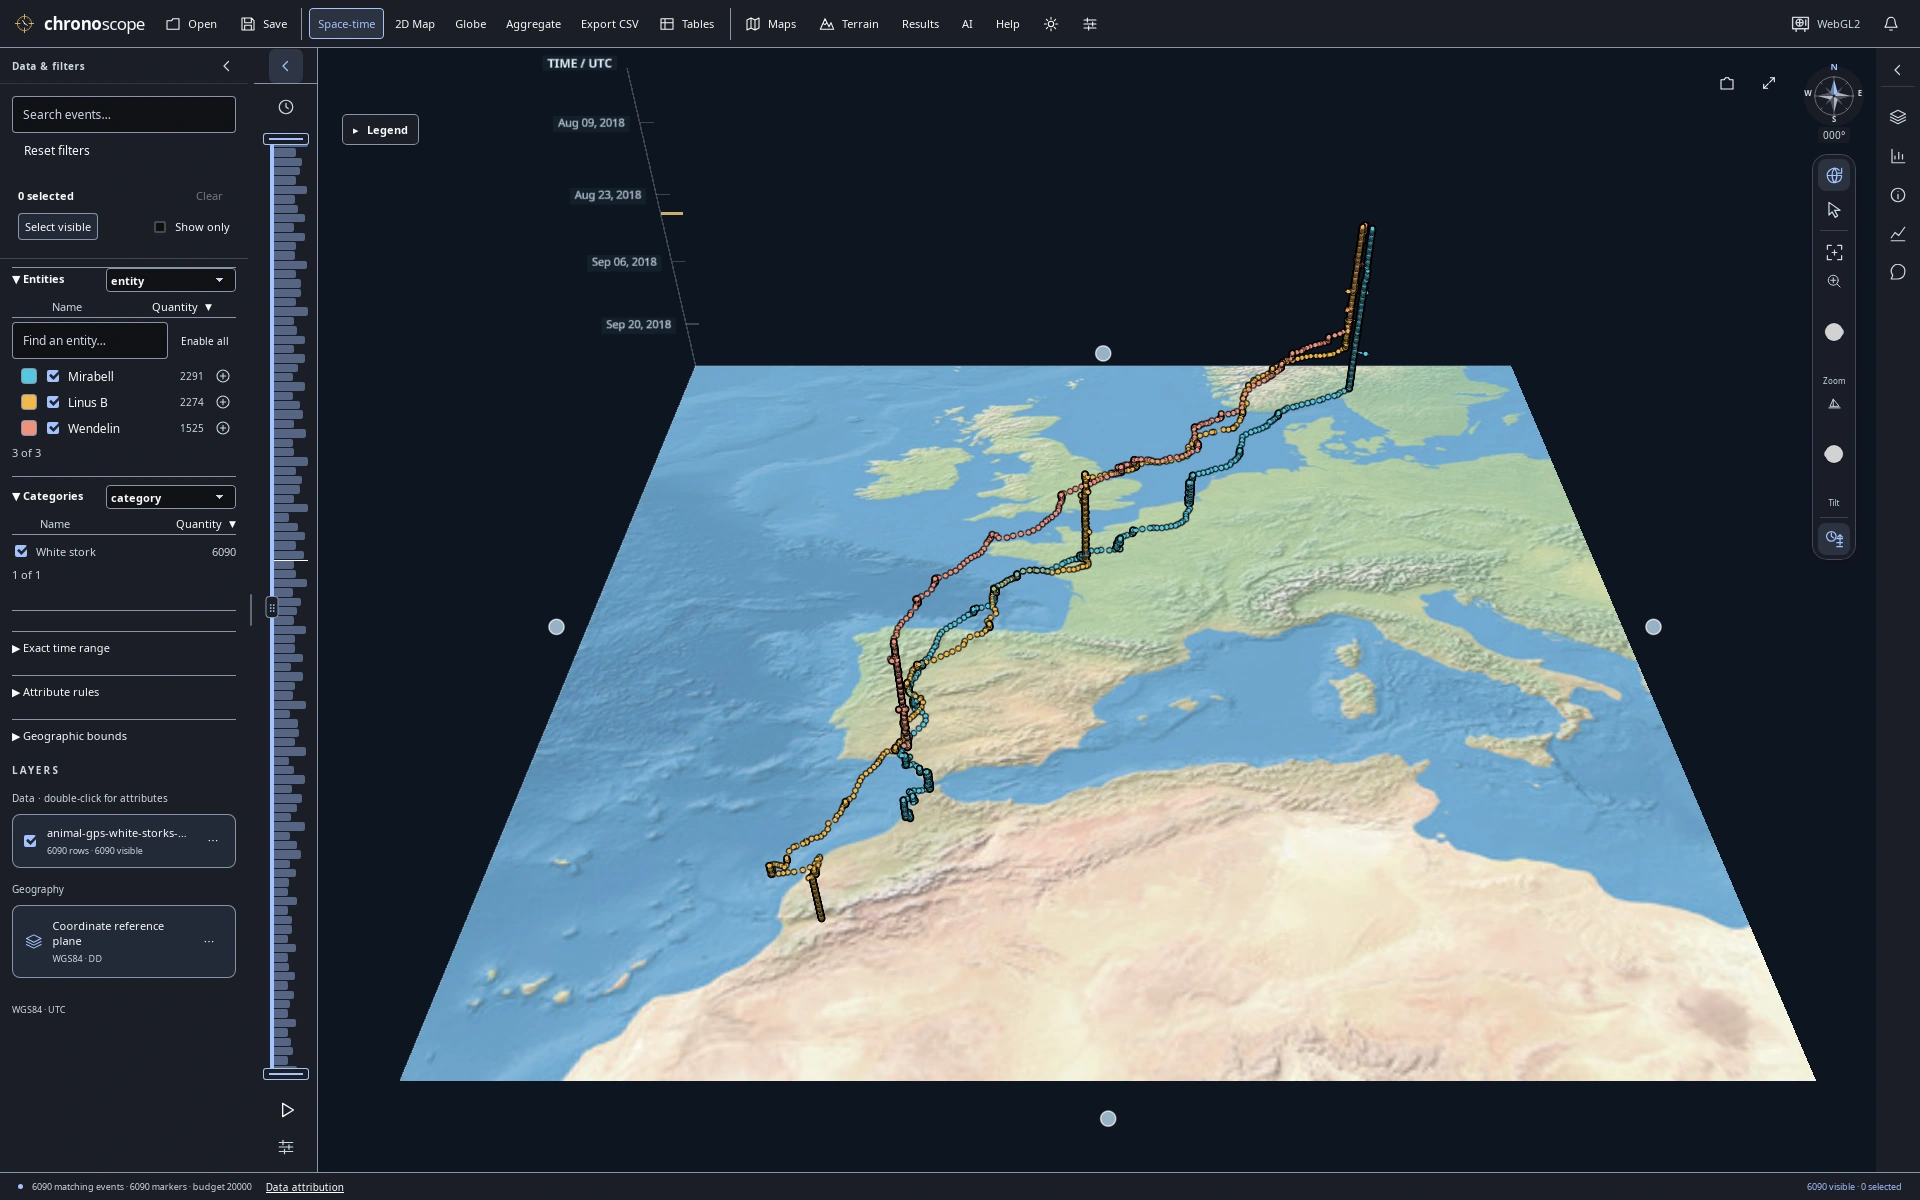
A migration drawn through time
Three white storks from Europe to North Africa; height encodes UTC time, not altitude.
16 selected views · 1920 × 1200 PNGs · October 22, 2026 Data & map credits ↓
A wider view.
A closer look.
Move between a 2D map, a globe and space-time views. Keep charts and source records beside the map to see the same observations from different angles.
Follow recorded journeys
One dataset. Different perspectives on movement.
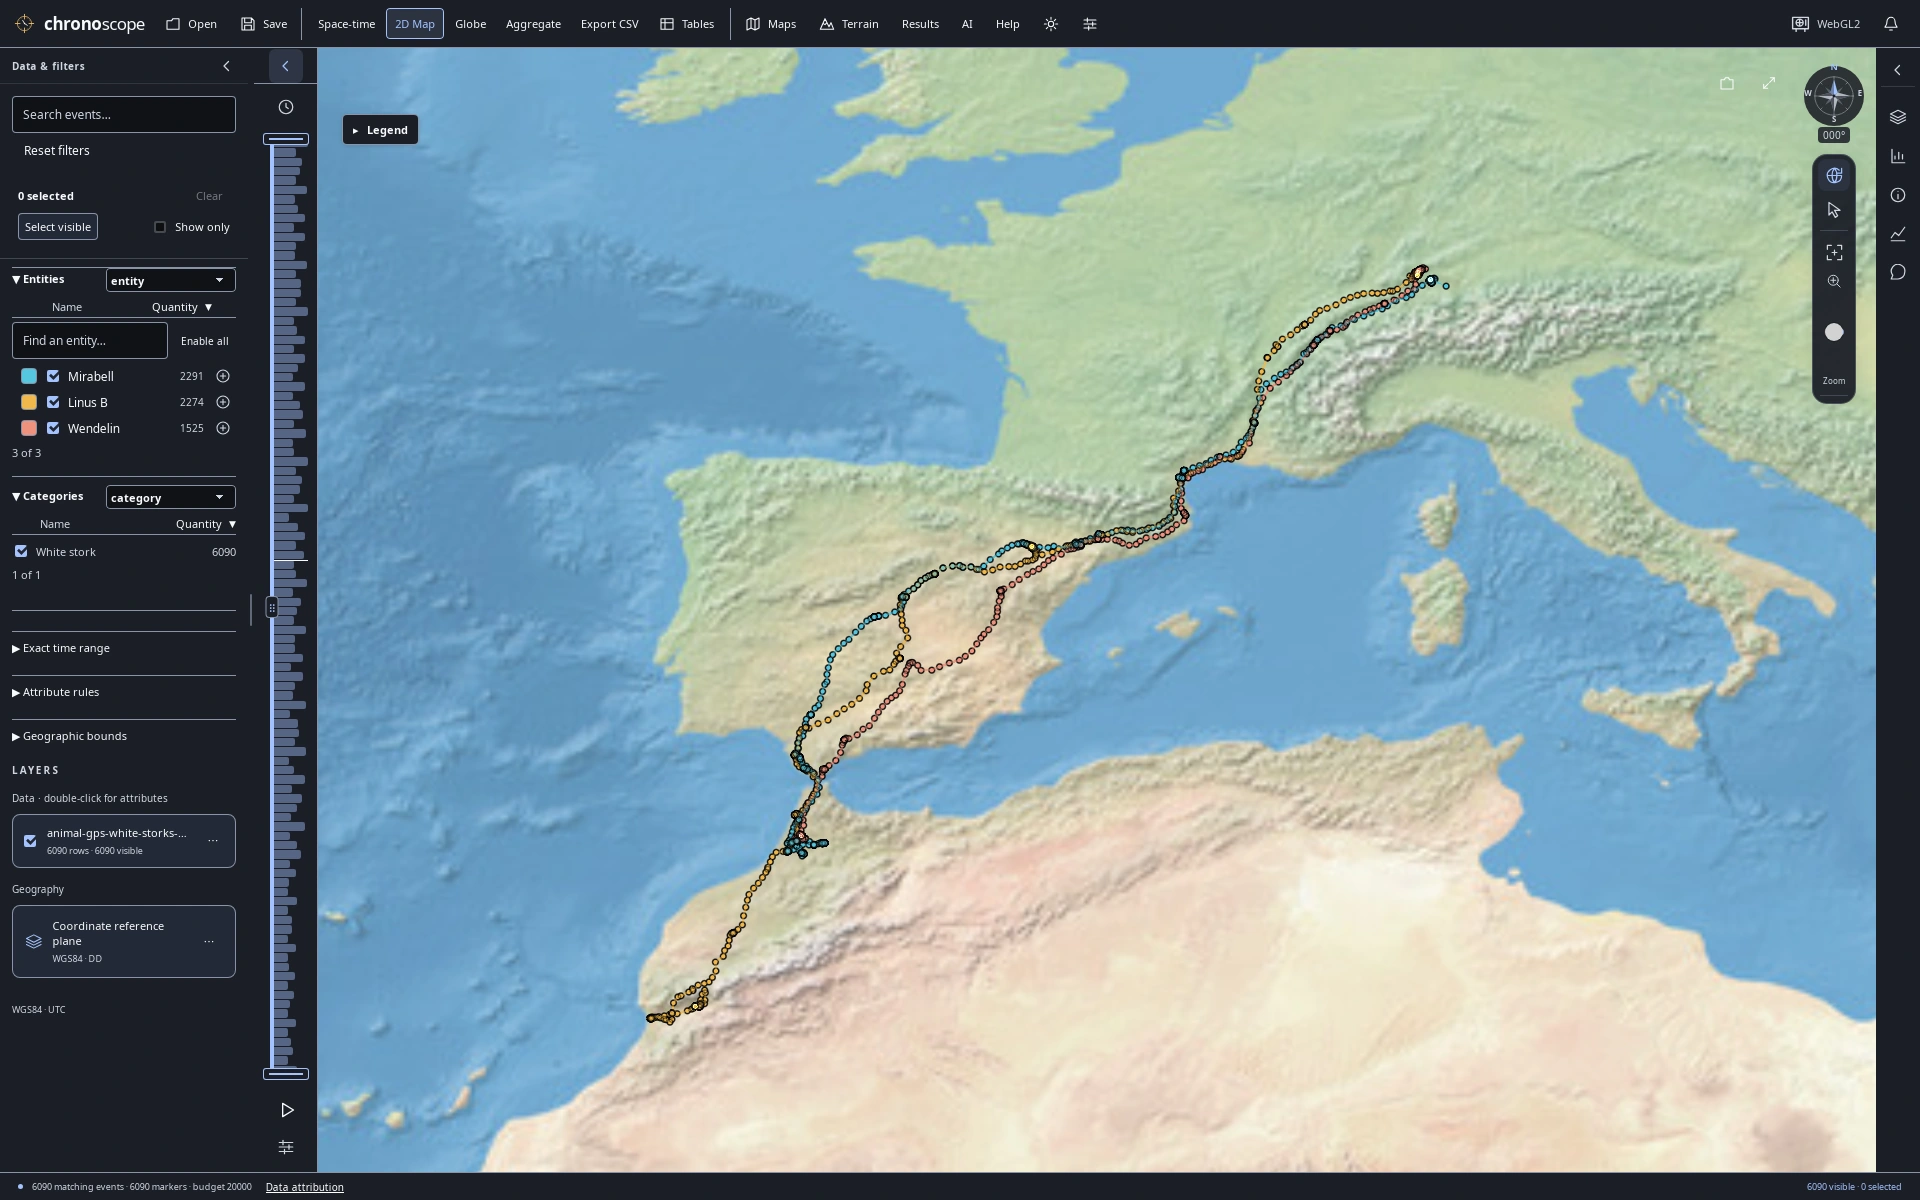
Three birds, three journeys
The same 6,090 recorded GPS fixes in a 2D map, colored by bird.
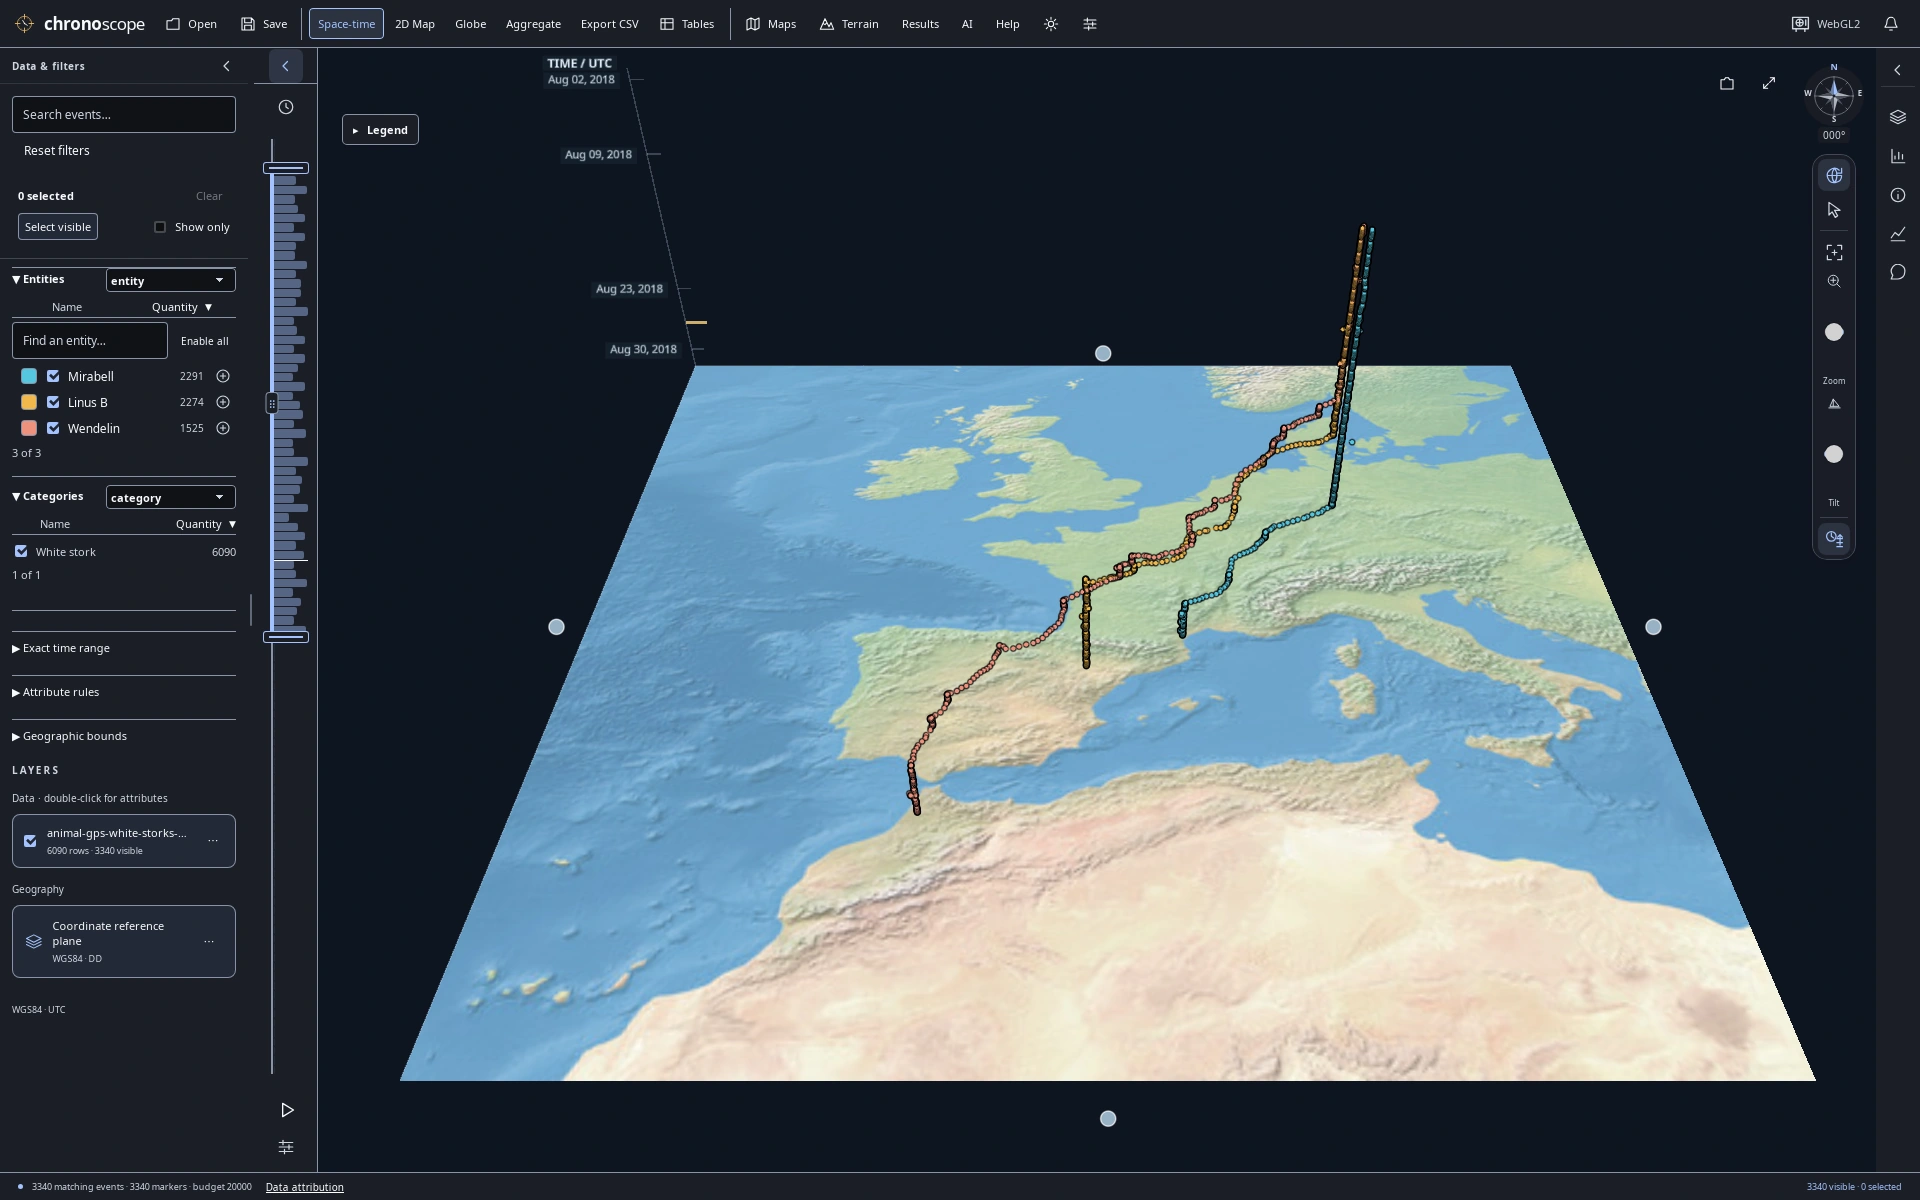
August departure
Narrow the time window to August: 3,340 matching GPS fixes from the stork dataset.
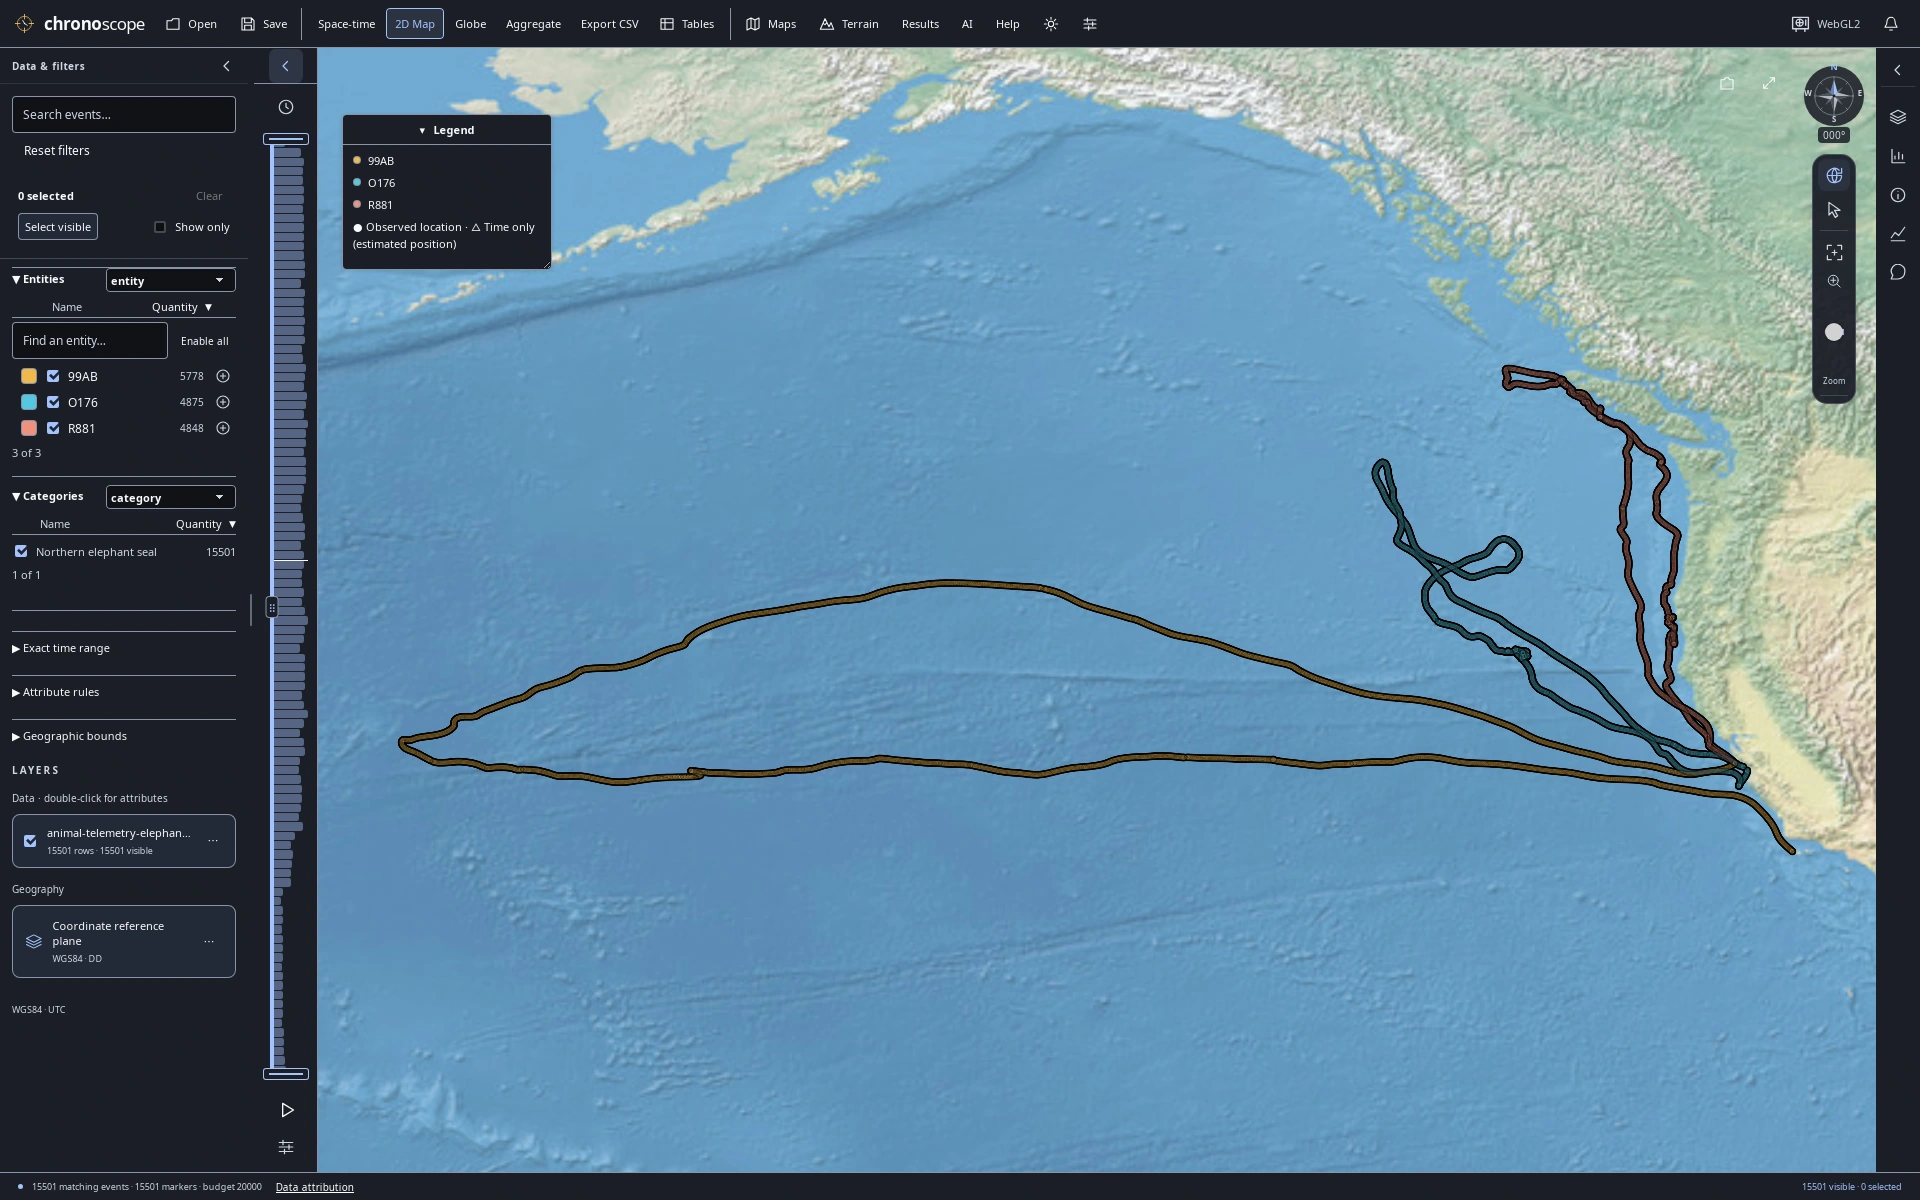
Ocean journeys
15,501 published dive summaries from three elephant seals; positions are modeled dive starts, not underwater paths.
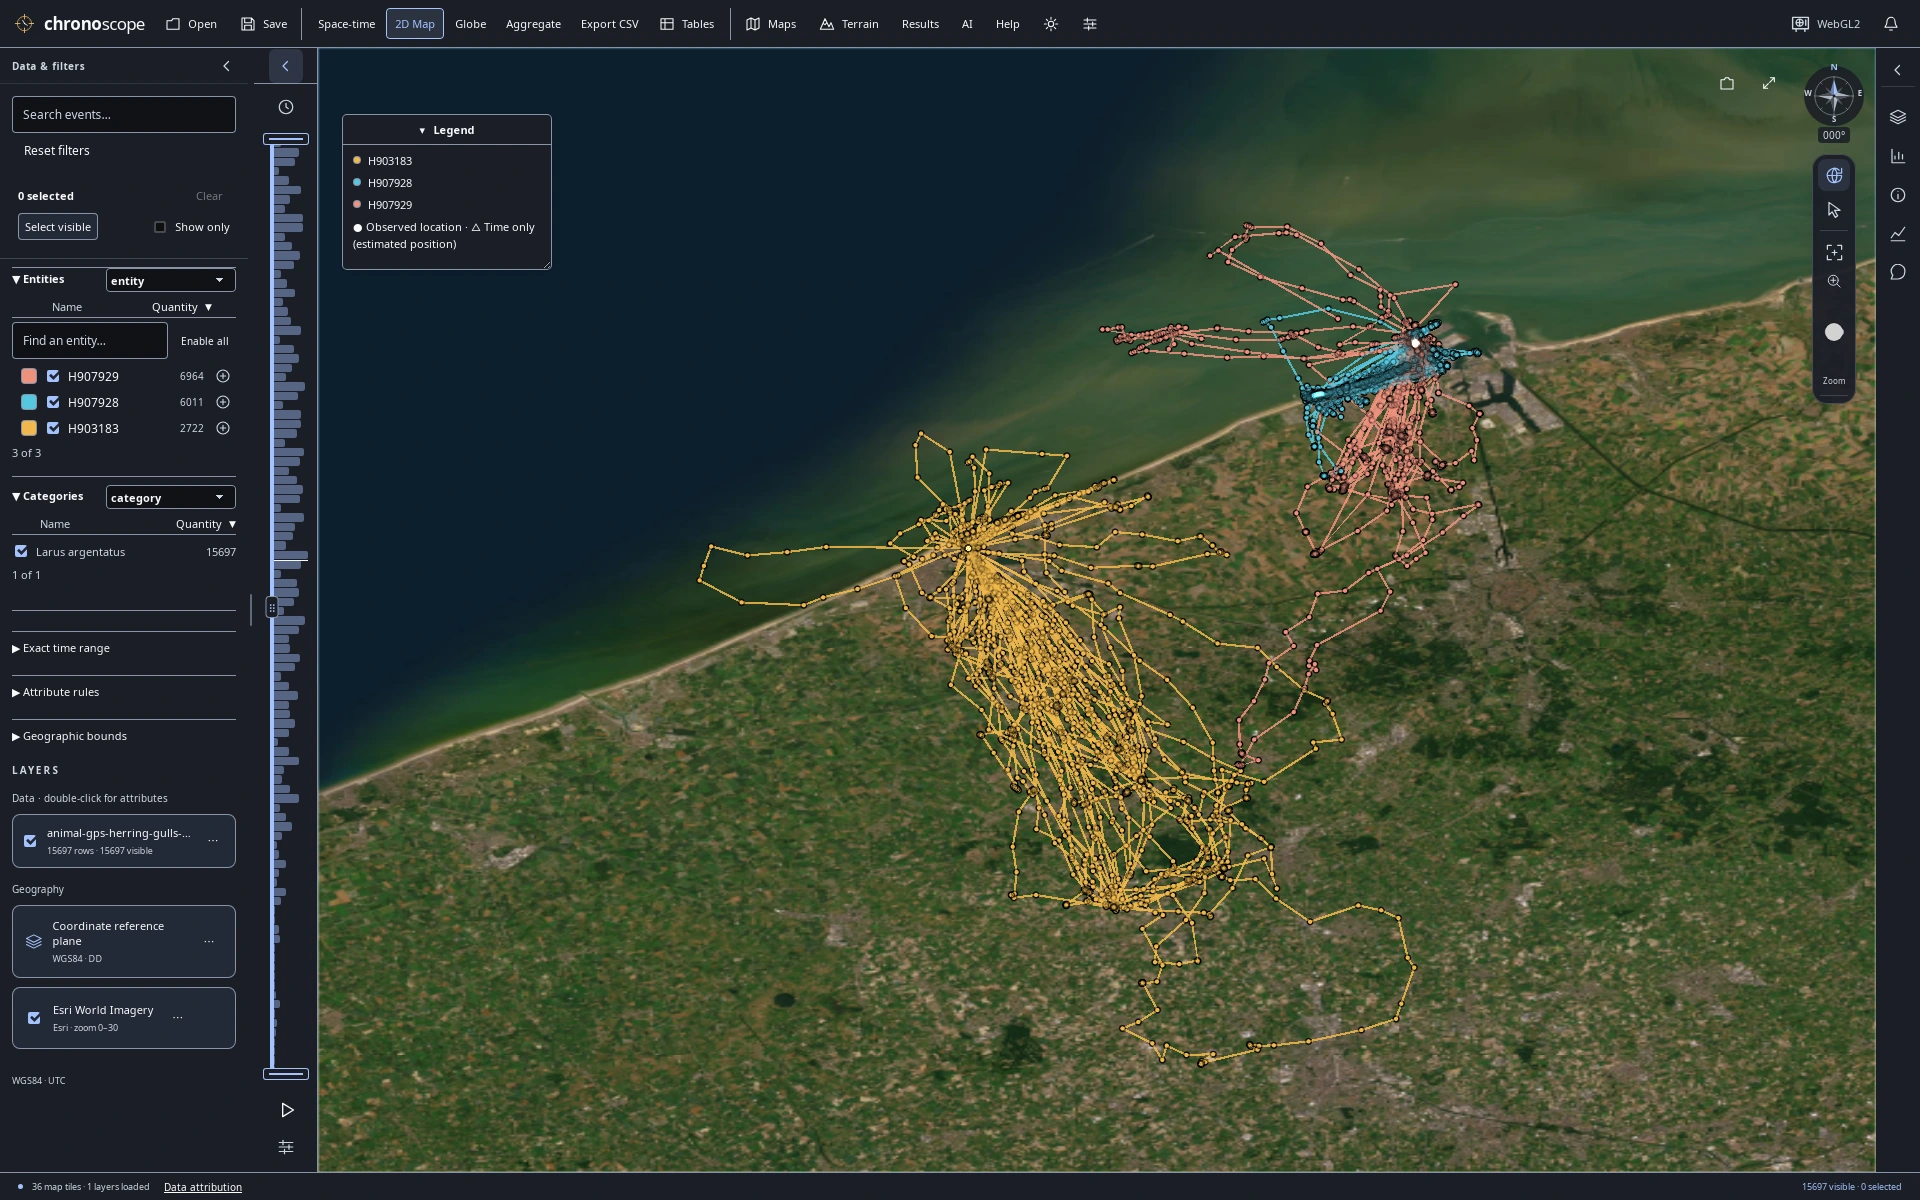
Along the Belgian coast
Three herring gulls along the Belgian coast. Connected GPS fixes do not establish continuous routes.
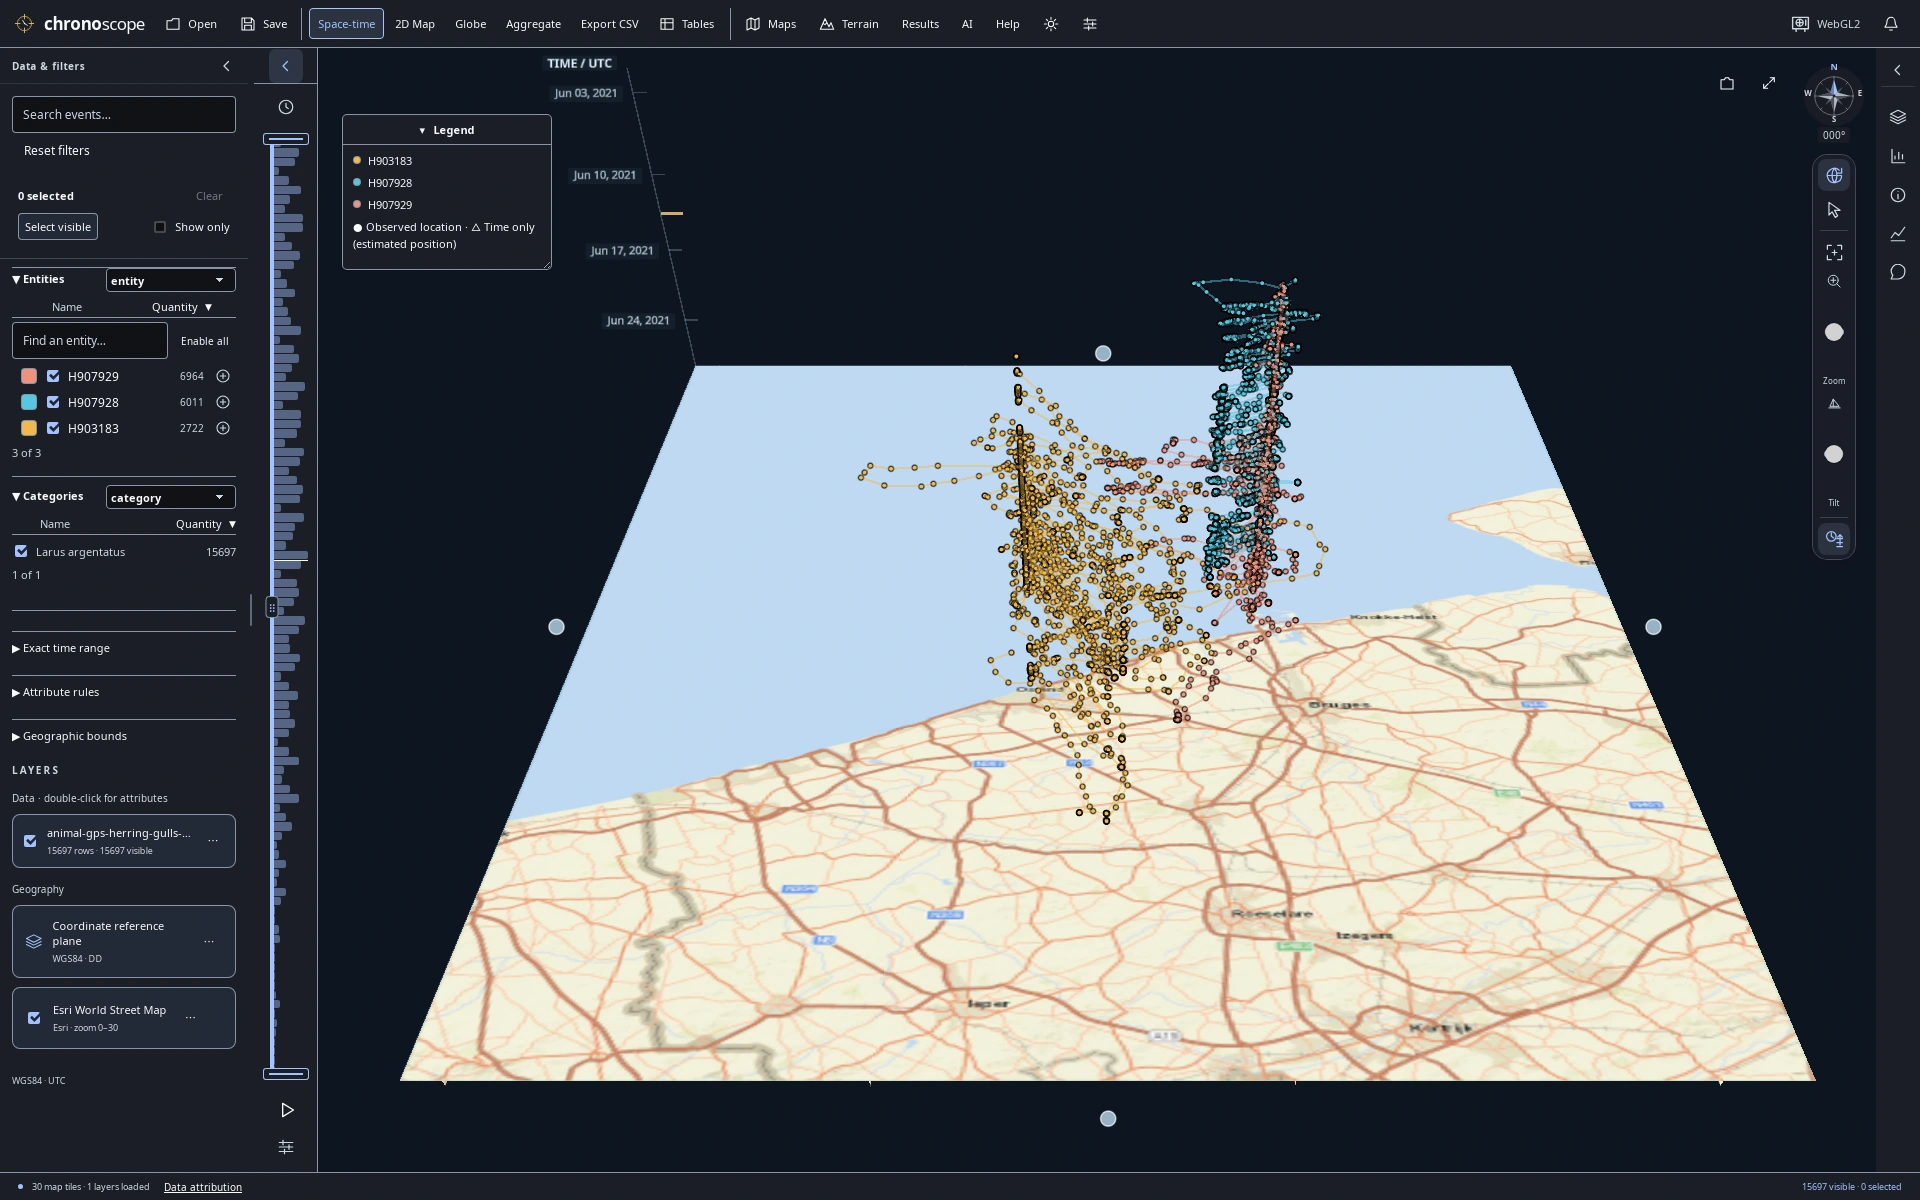
Coastal movement through June
Follow the same June 2021 gull observations through time, with UTC time on the vertical axis.
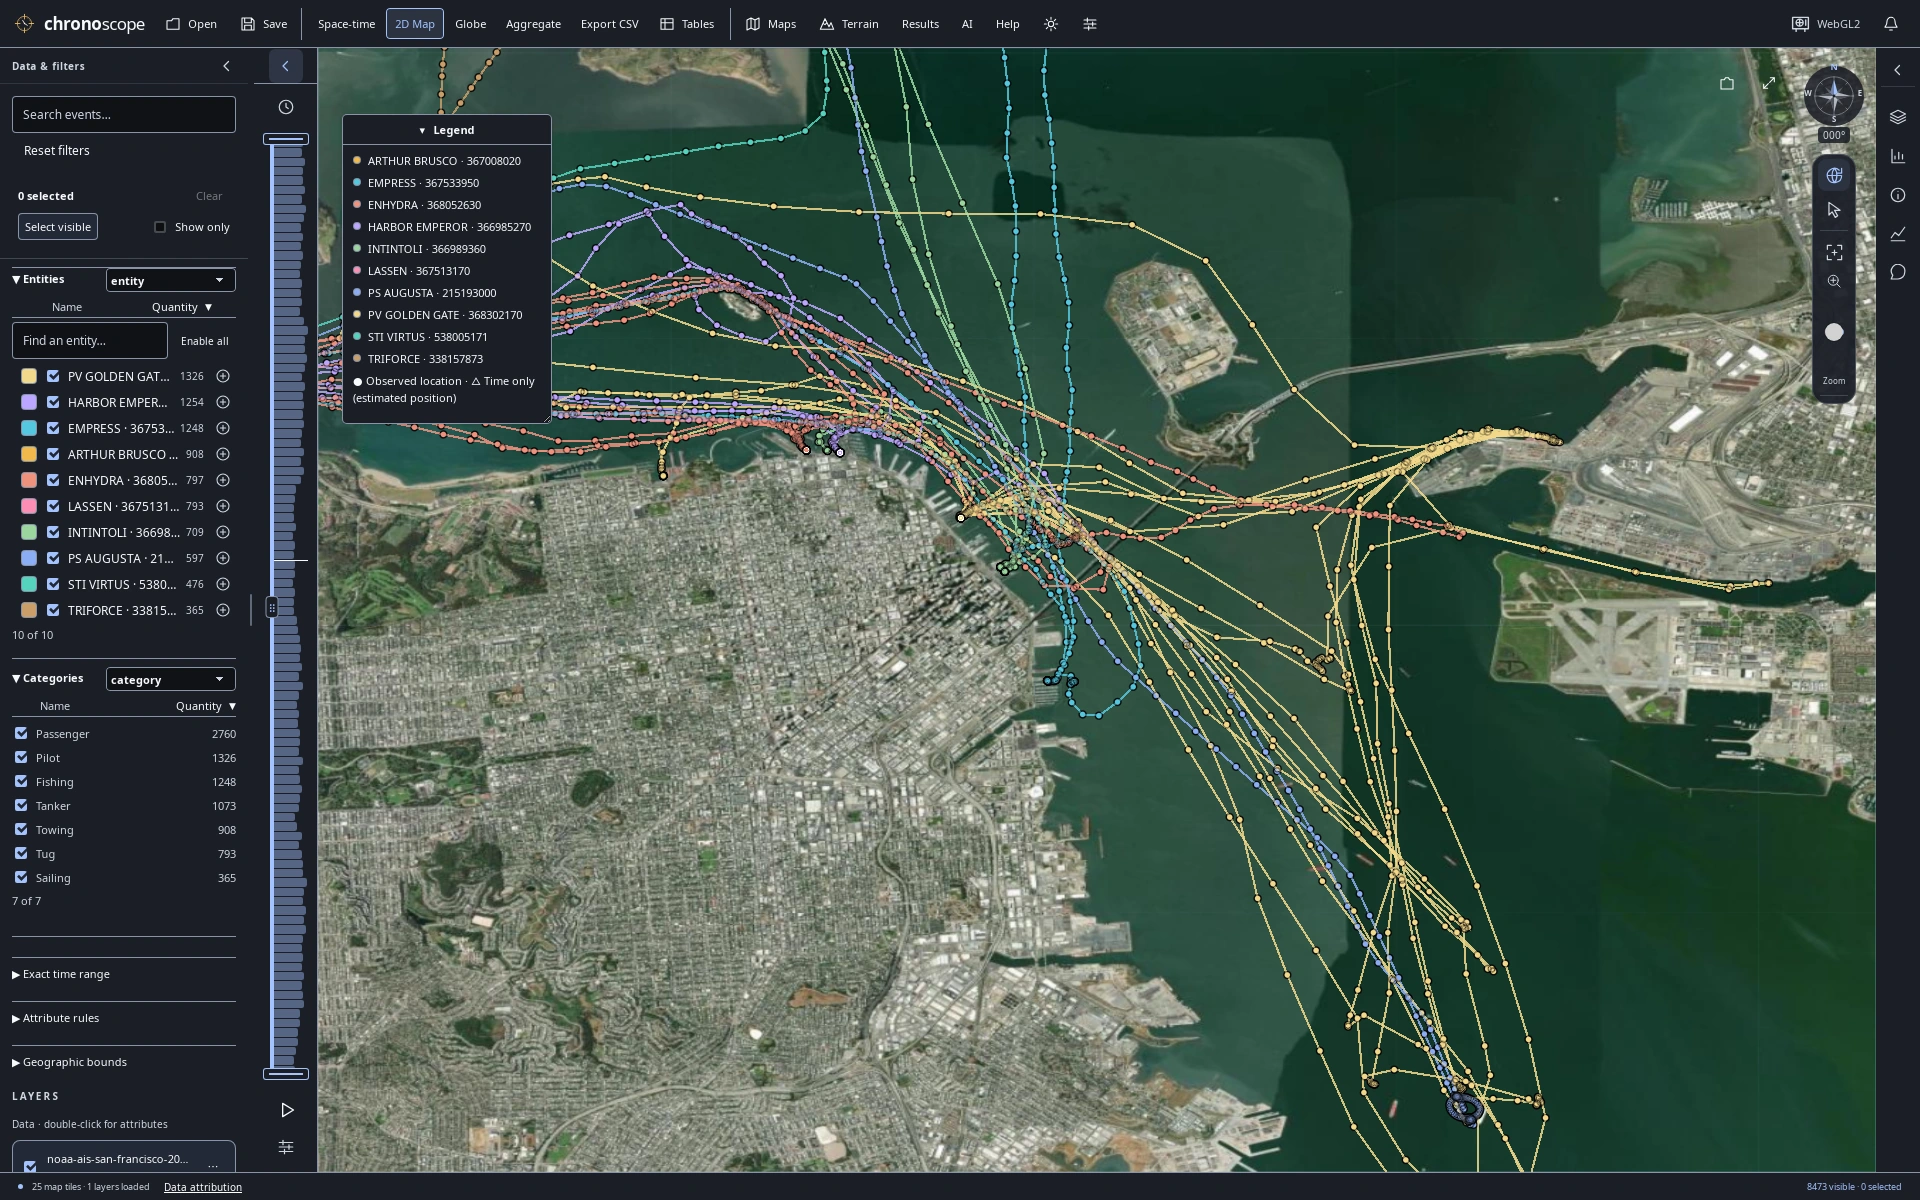
Approaching the waterfront
San Francisco Bay vessels over satellite imagery: recorded AIS samples, not independent voyages. Not for navigation.
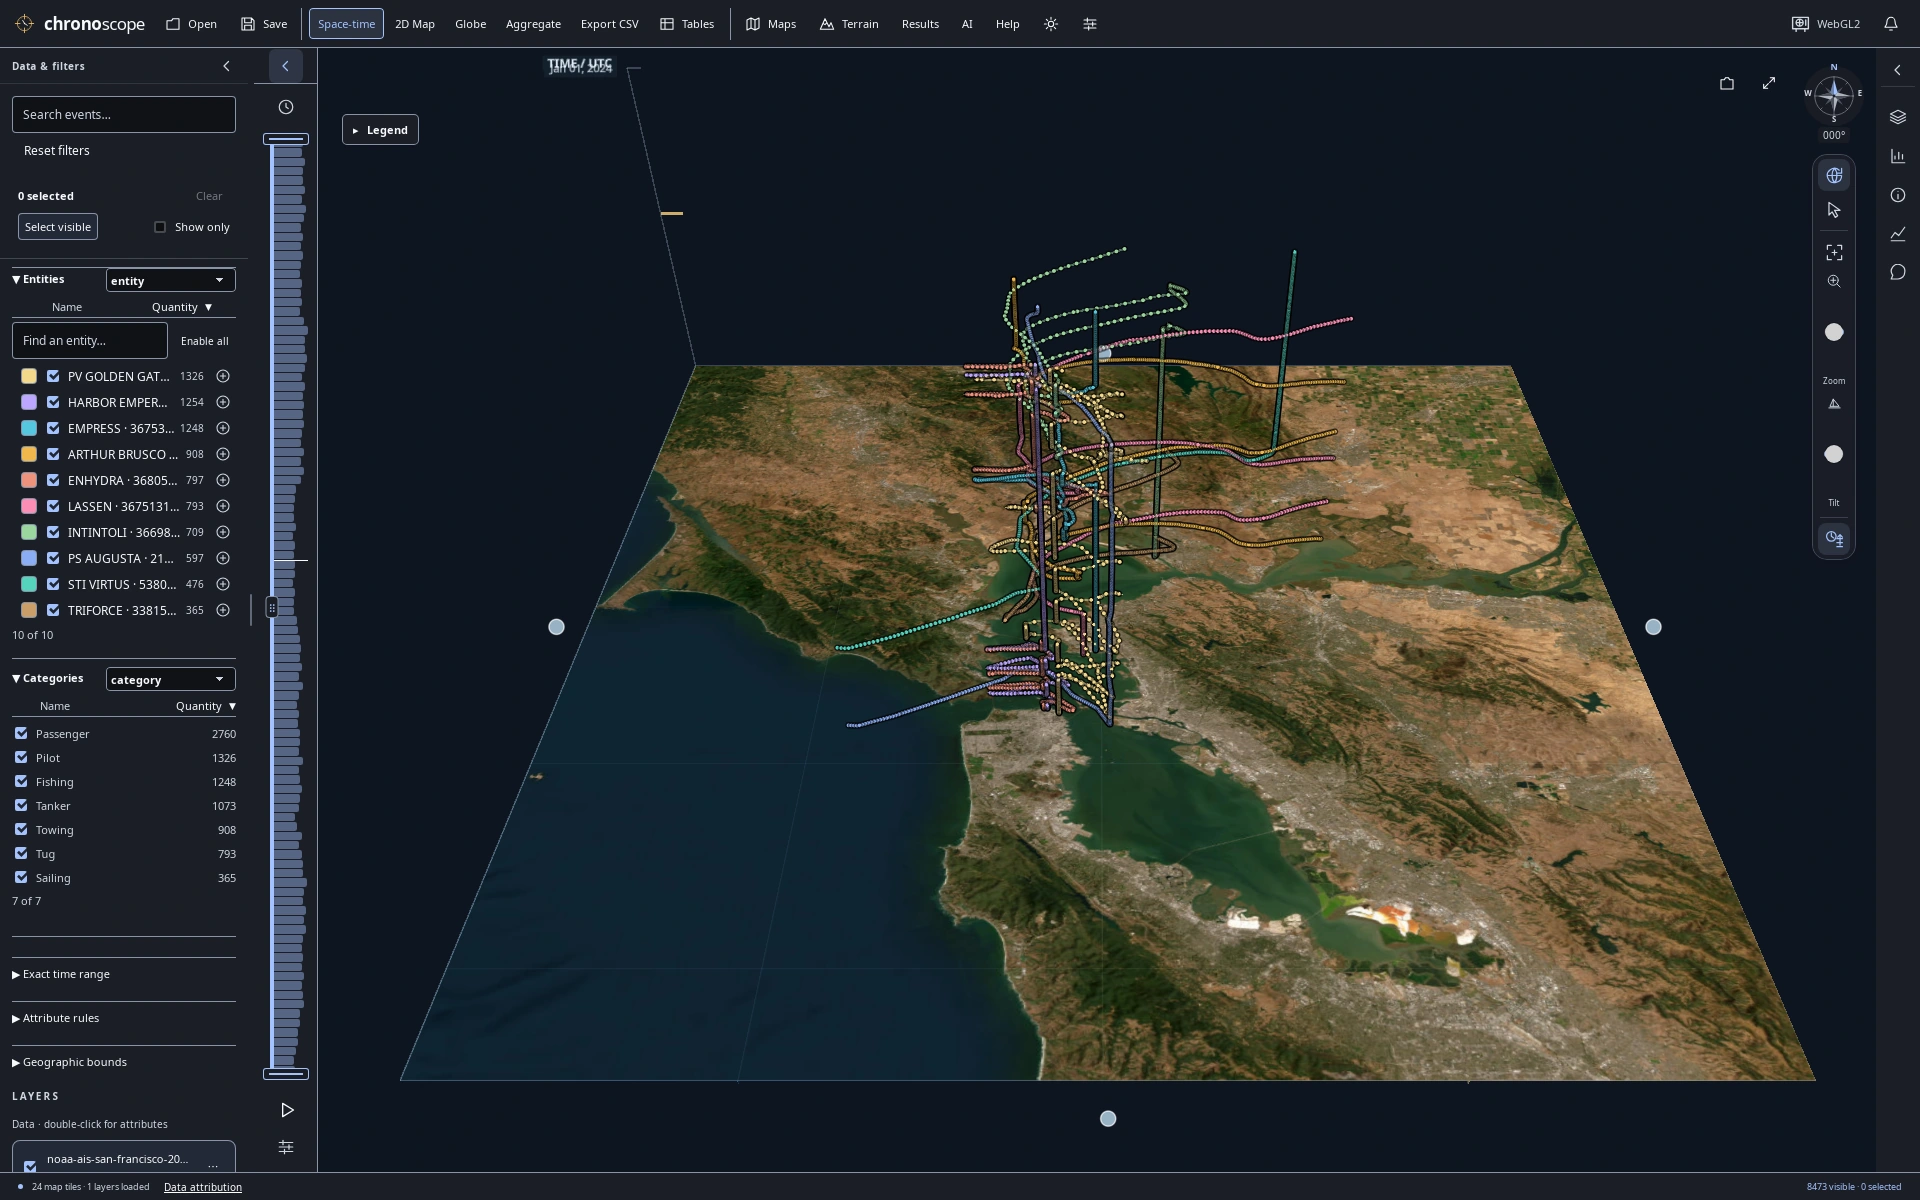
A day of traffic in three dimensions
Raise a day of Bay traffic by UTC timestamp to separate movement through time.
Compare recorded measurements
Read a chart, inspect its source records, keep the map in view.
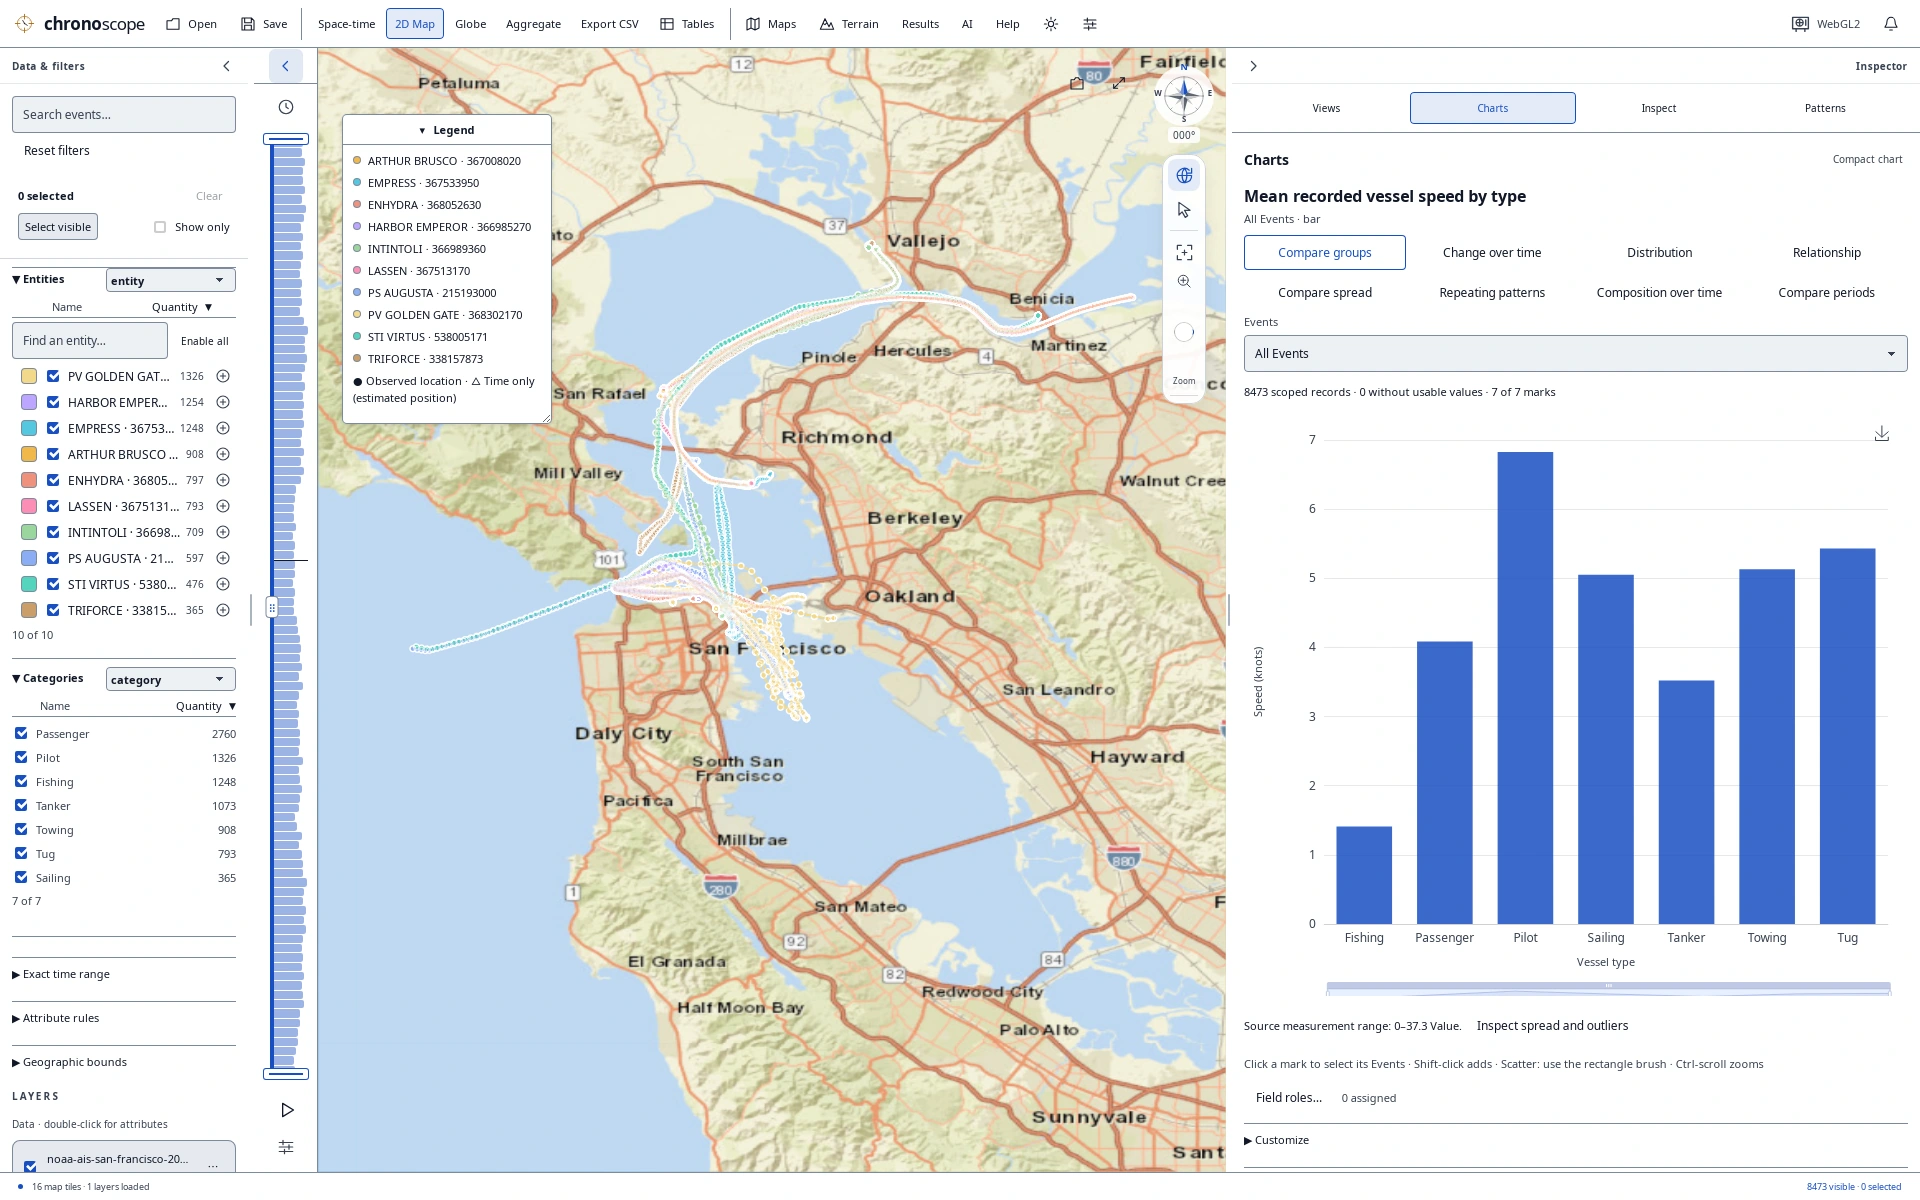
Vessel types and recorded speed
Compare recorded vessel speed by vessel type alongside the map and source records.
Explore the planet
Storm tracks and surface epicenters on a globe.
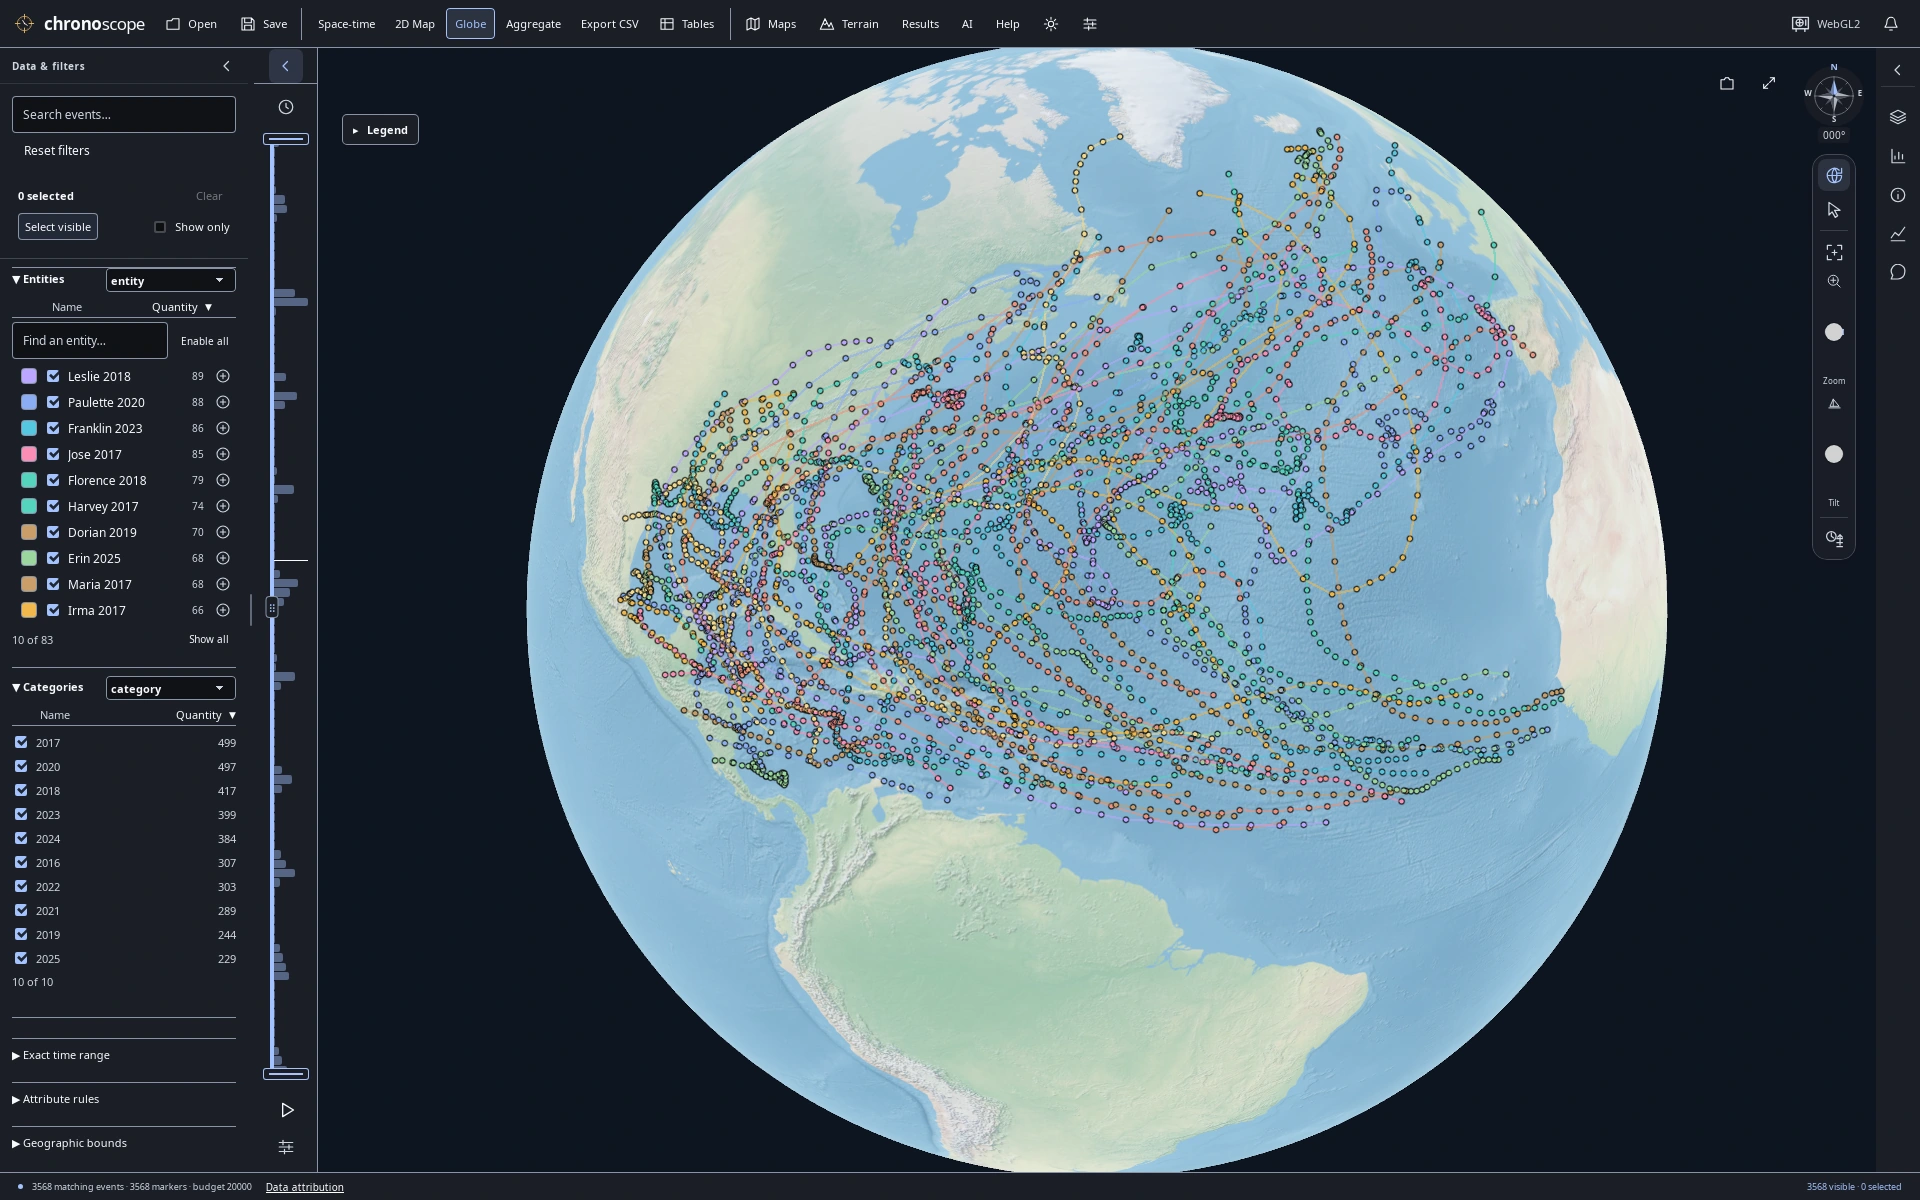
A decade across the Atlantic
3,568 NHC best-track observations connect 83 Atlantic storms from 2016–2025; reported wind is in knots.
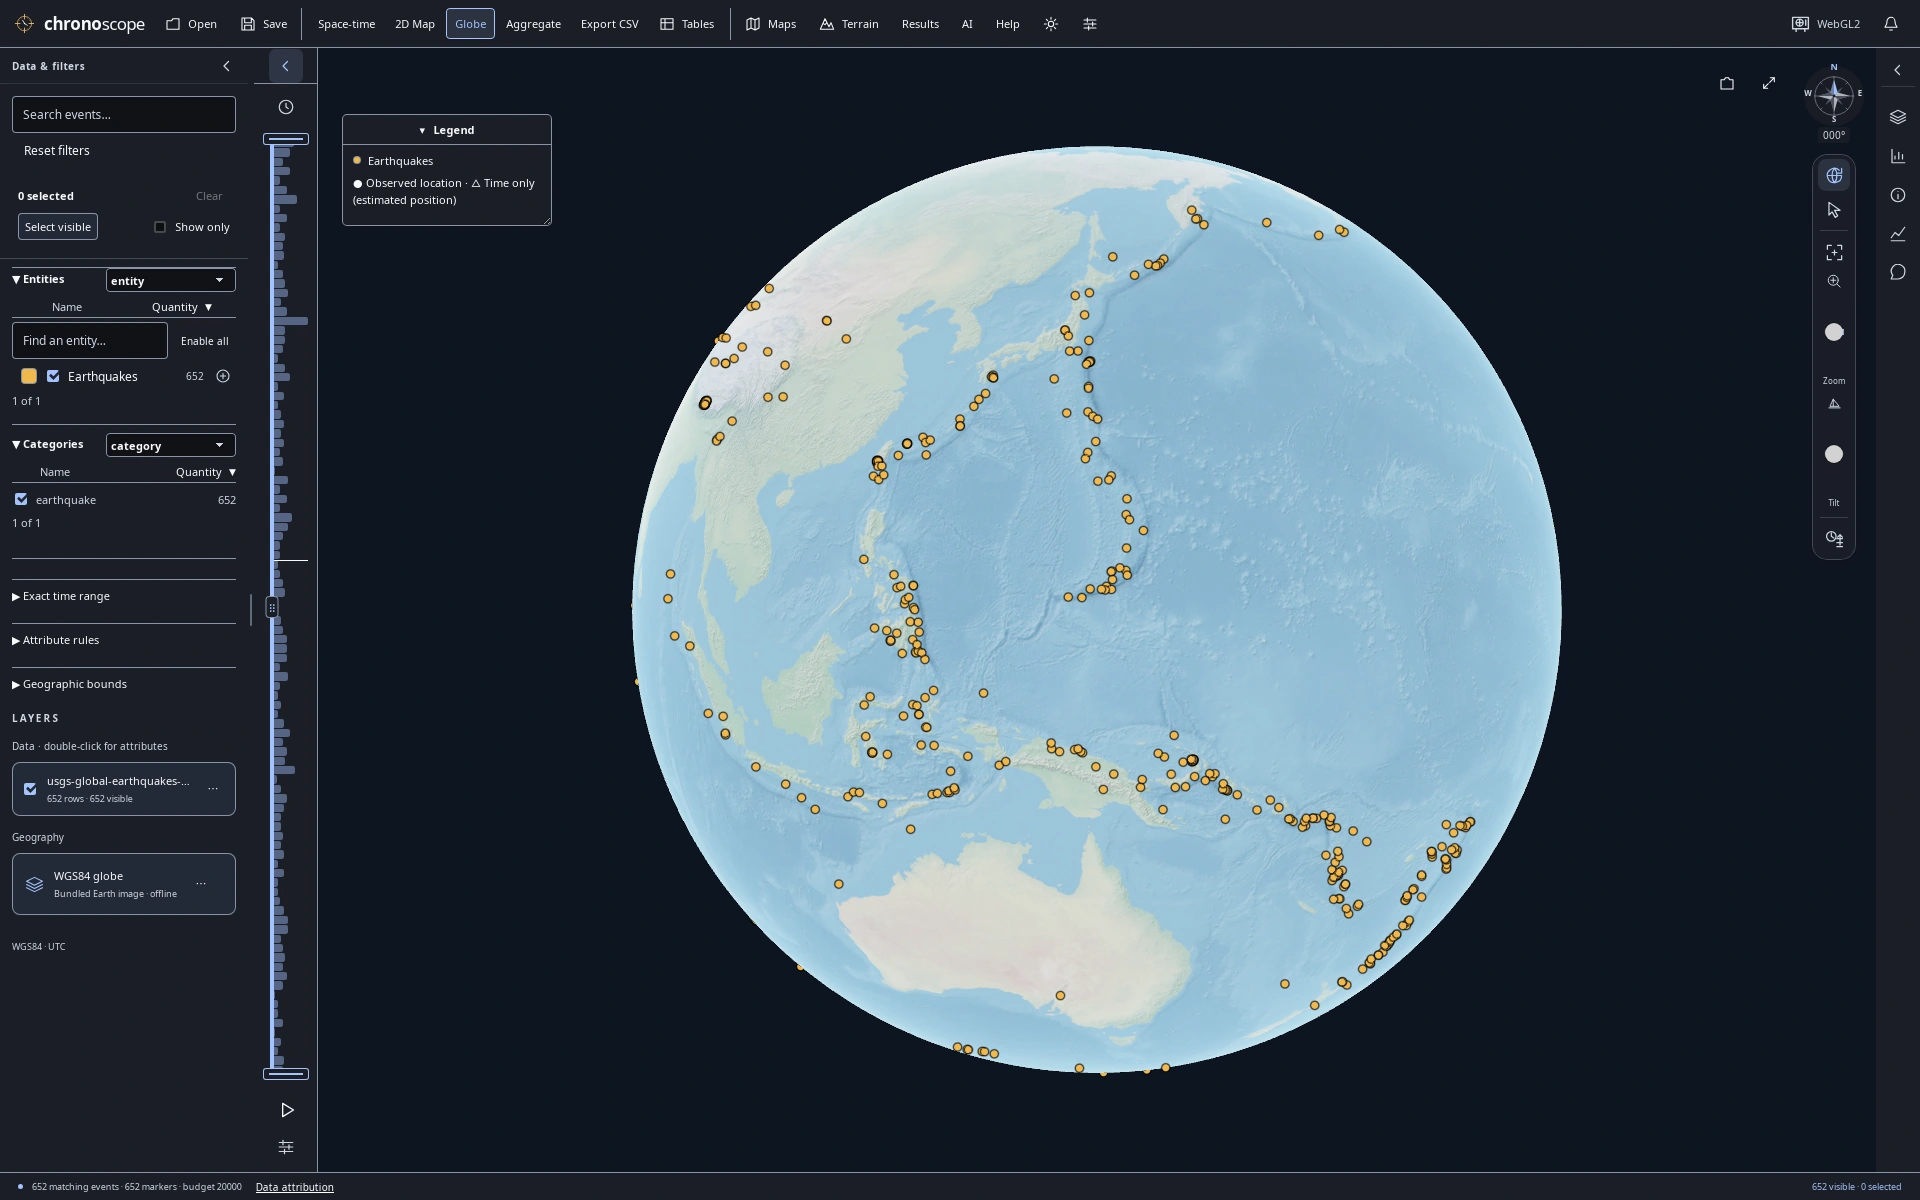
The Pacific Ring of Fire
USGS January 2025 earthquakes of reported magnitude ≥4.5. Surface epicenters, not depth; one hemisphere is visible.
Read patterns in published reports
Look closely at what counts and colors actually represent.
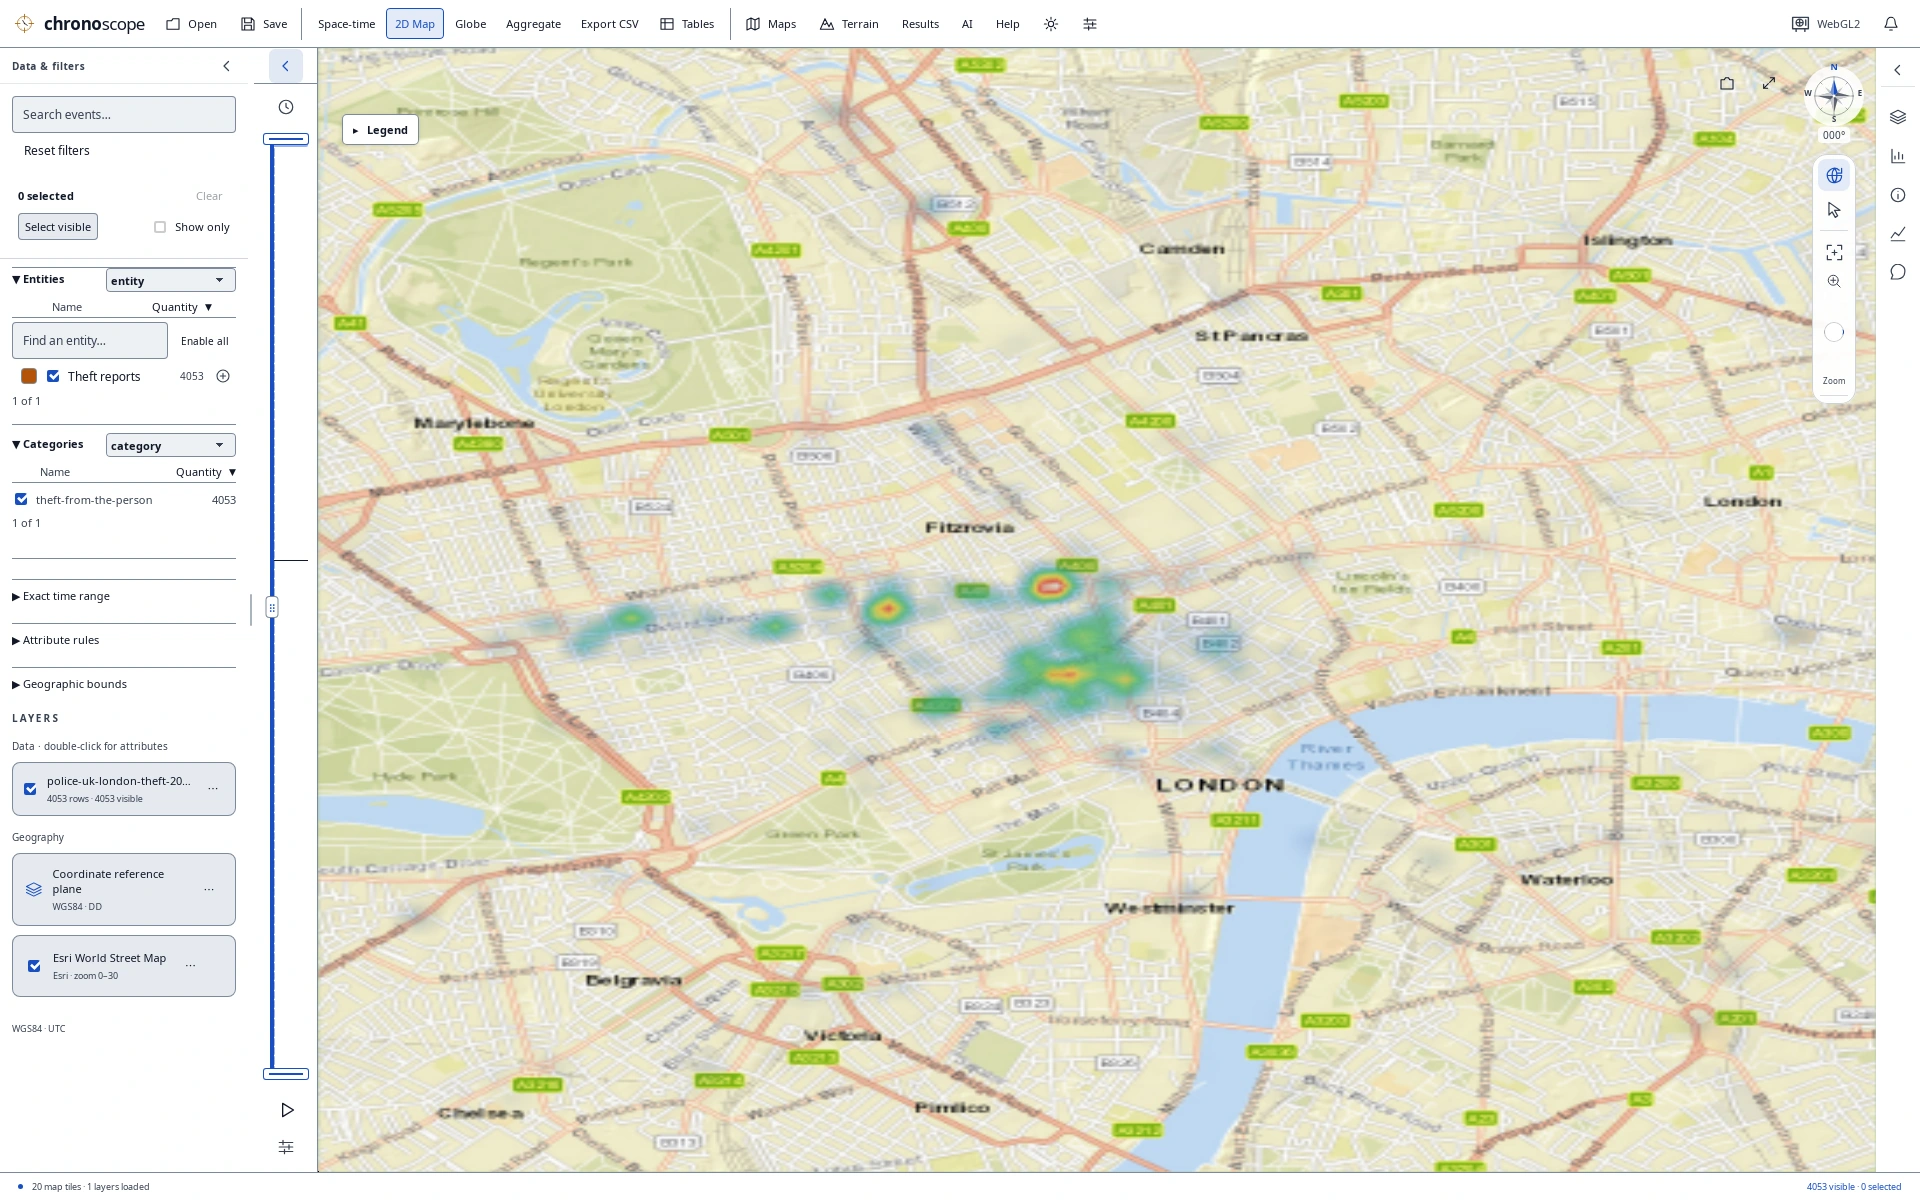
London heat map in daylight
4,053 Police.uk theft-from-the-person reports, smoothed at this zoom. Locations are approximate and dates resolve to the month—not population-adjusted risk.
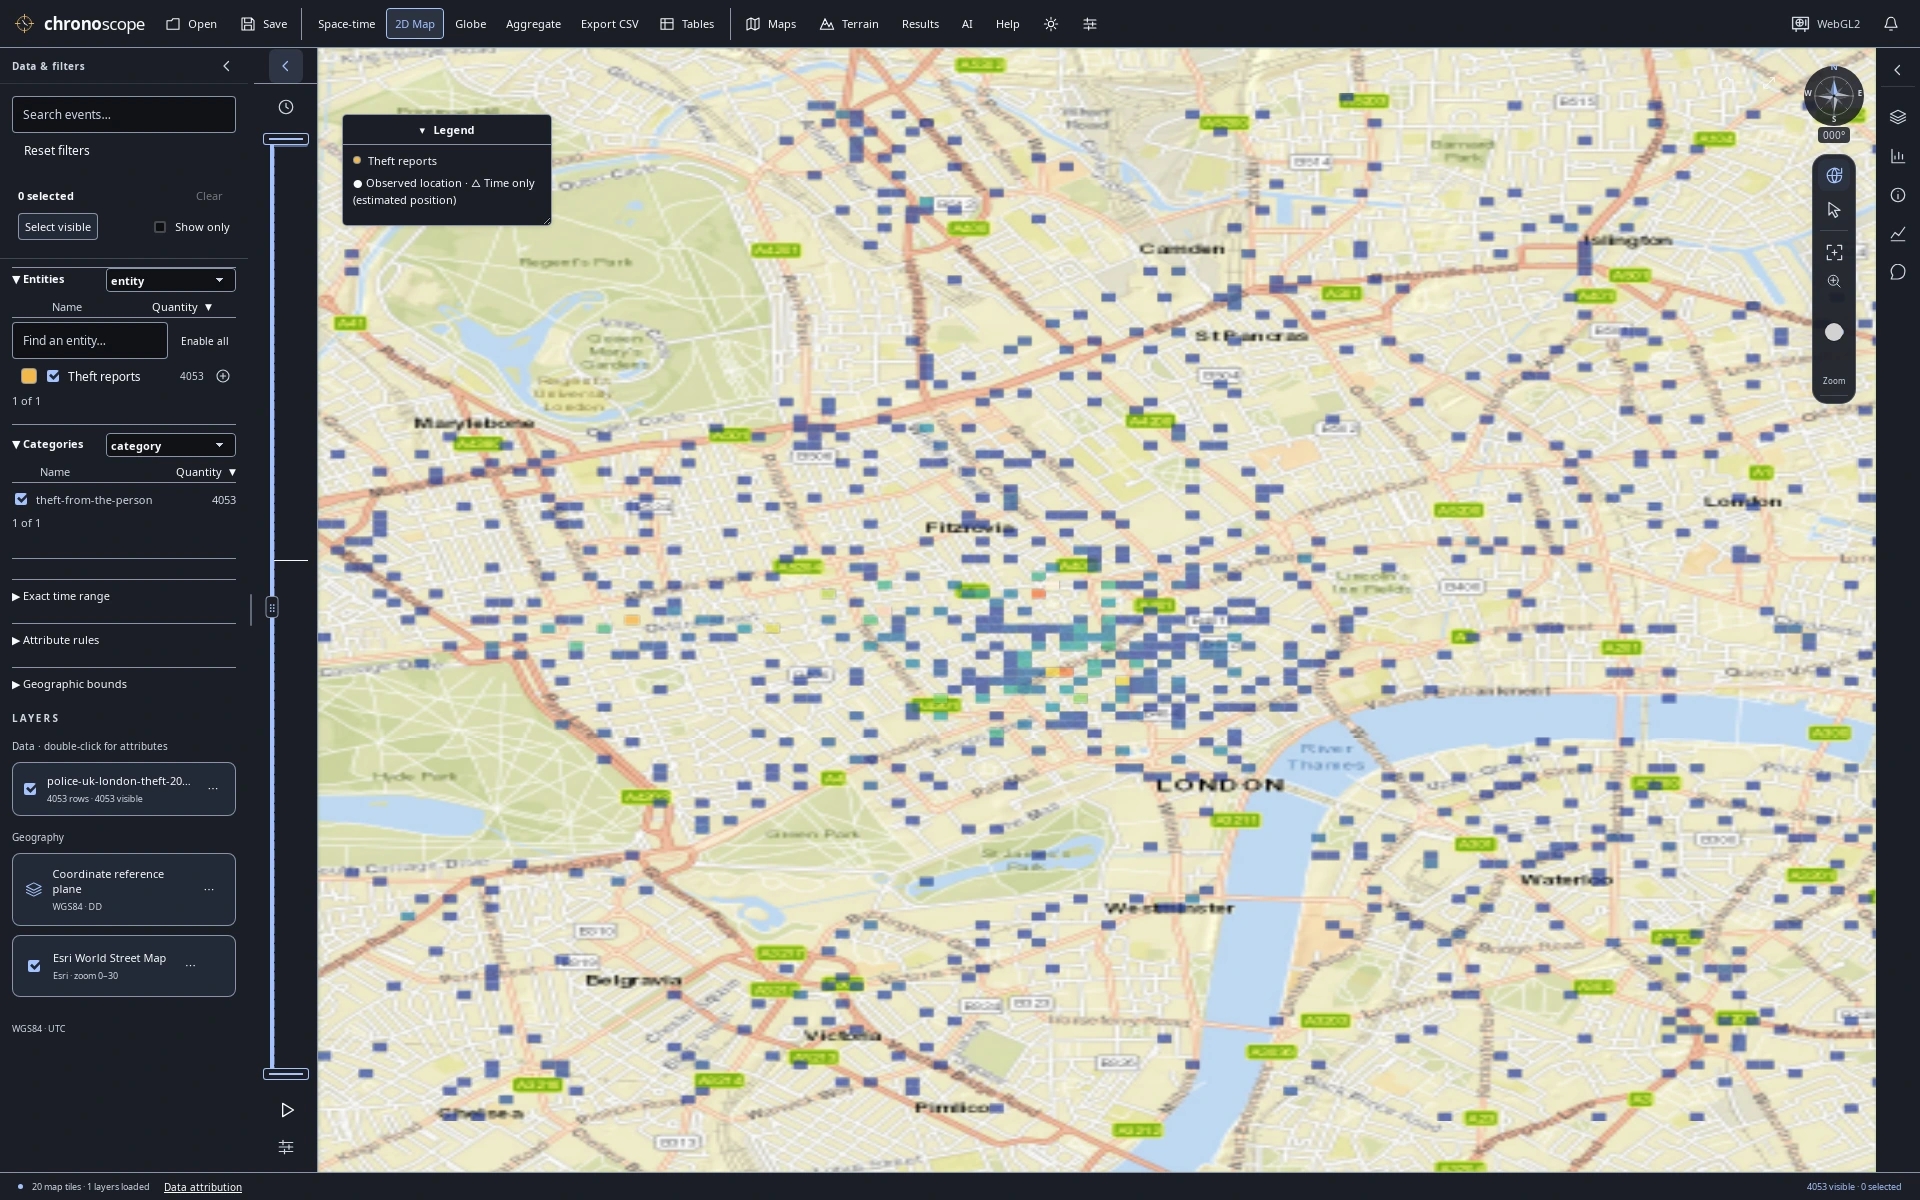
Published reports as count cells
The same published reports as display-grid counts. Cell colors summarize source records, not independent risk measurements.
Keep charts beside the map
A compact linked workspace for deeper comparisons.
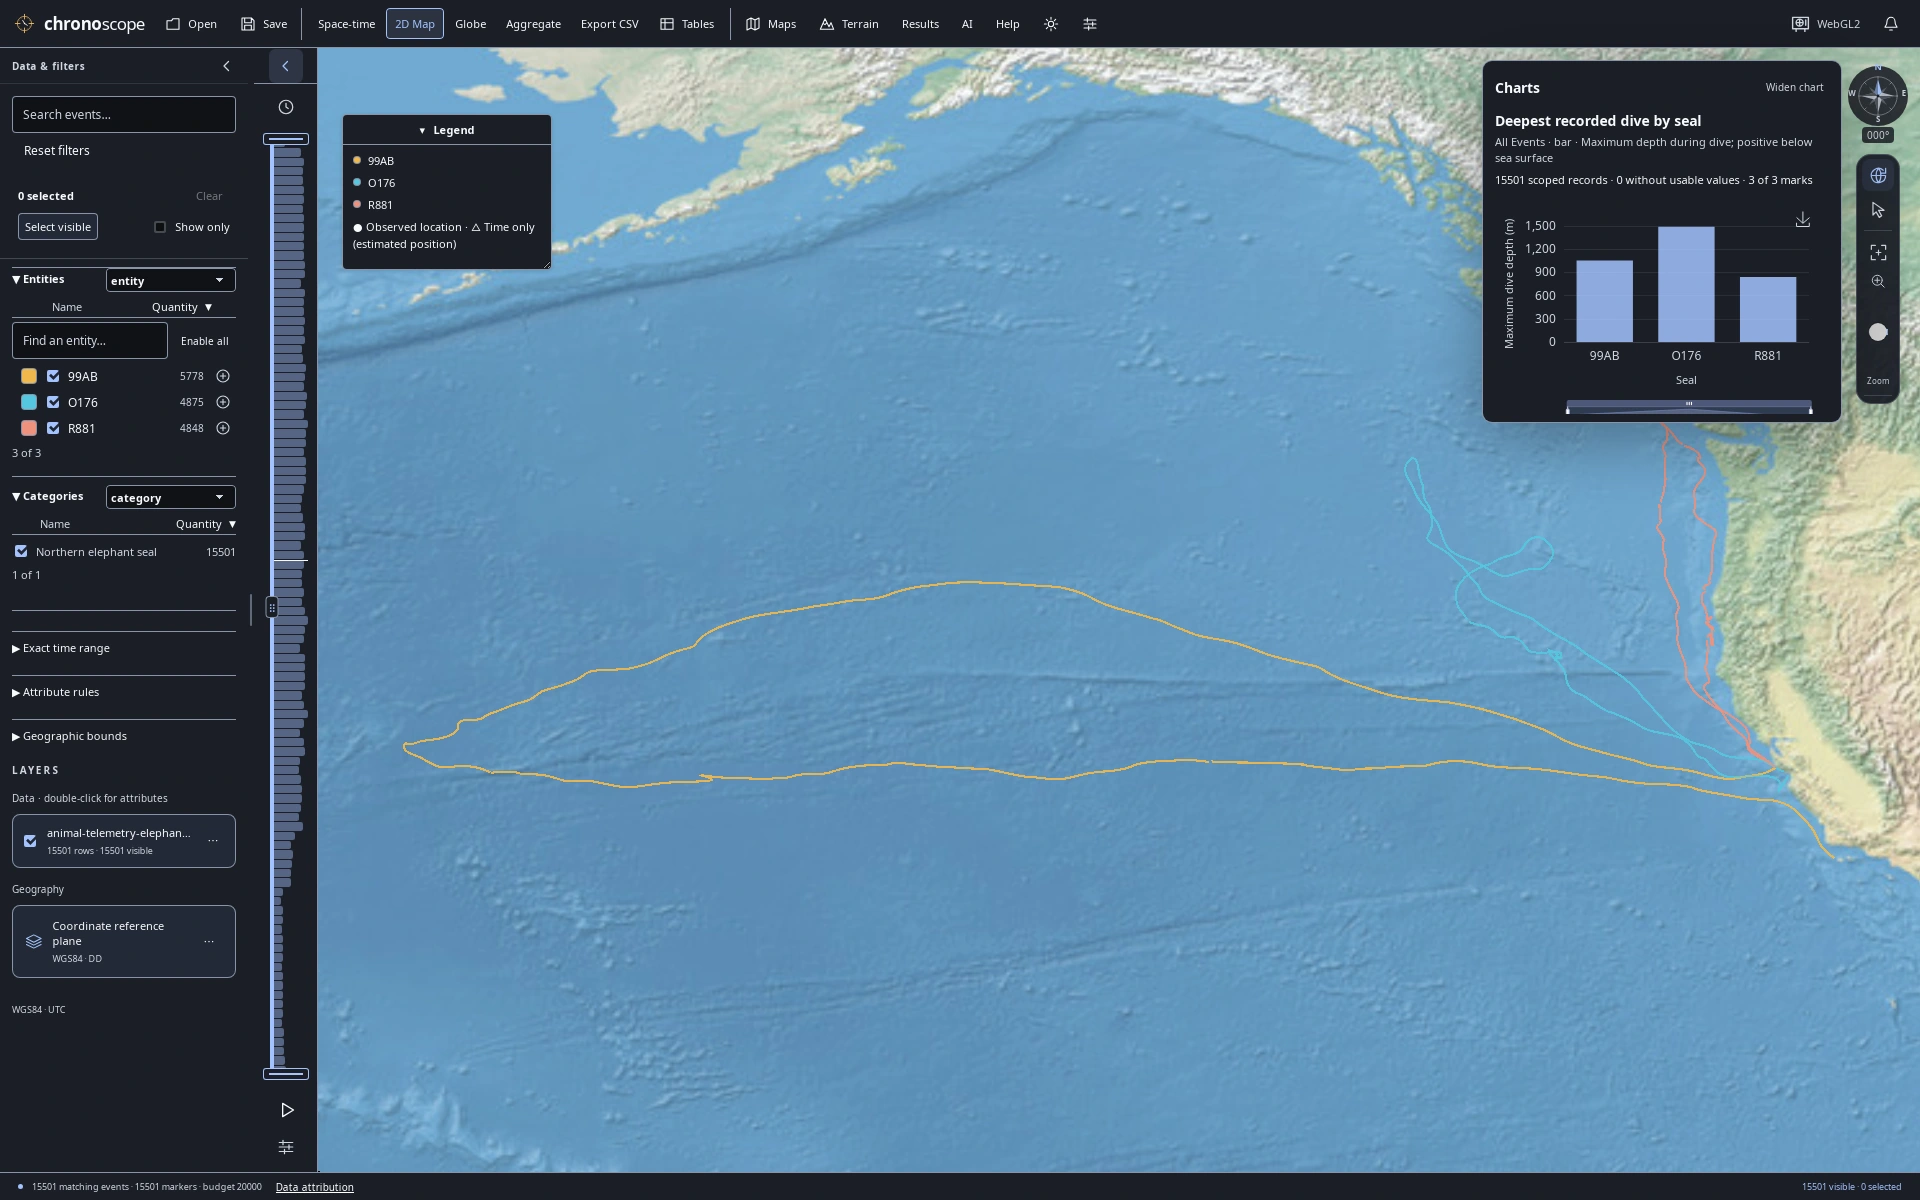
Dive depths beside ocean tracks
Keep a maximum dive-depth comparison beside the ocean tracks; depth is a recorded attribute, not map height.
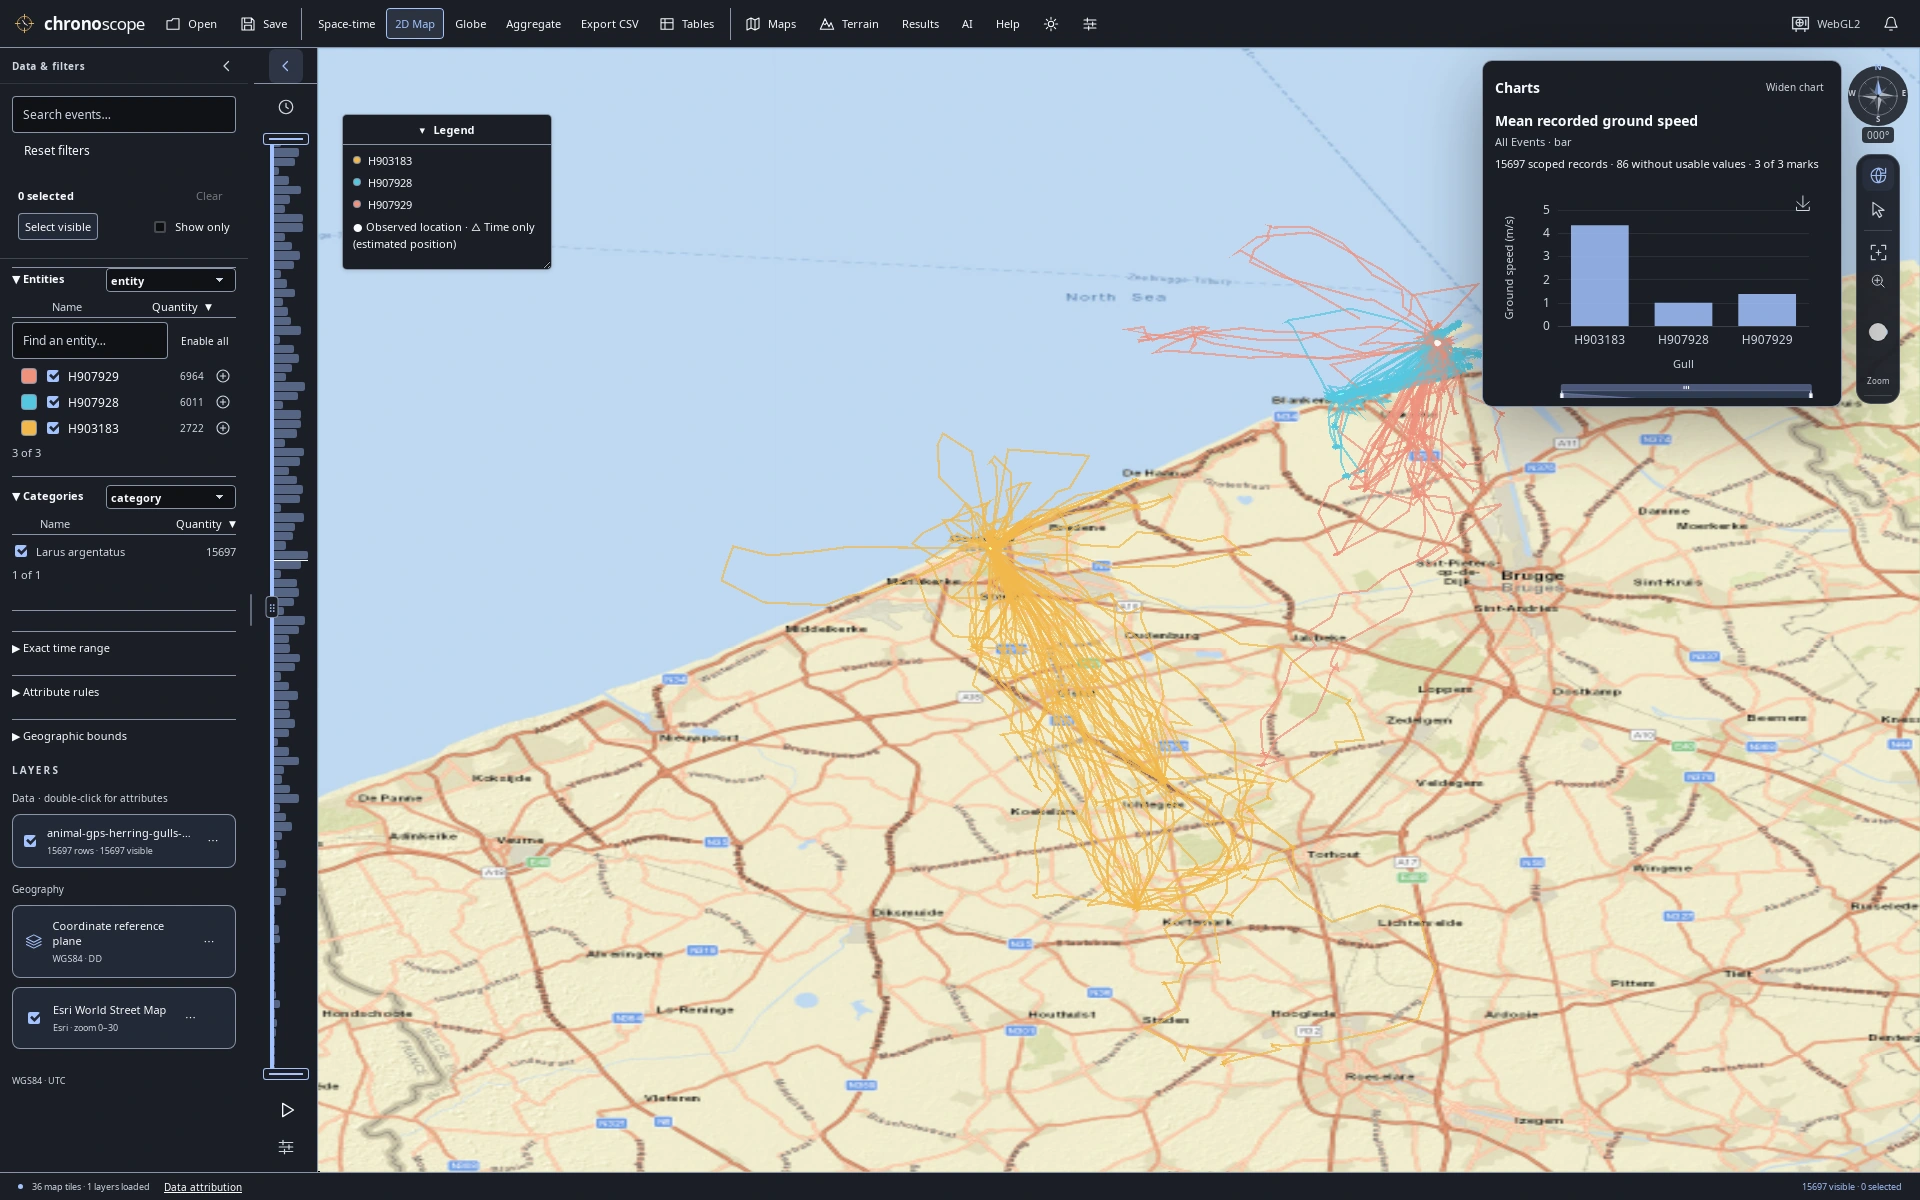
Coastal GPS with a compact speed chart
Inspect recorded gull speed alongside the coastal GPS fixes in a compact linked workspace.
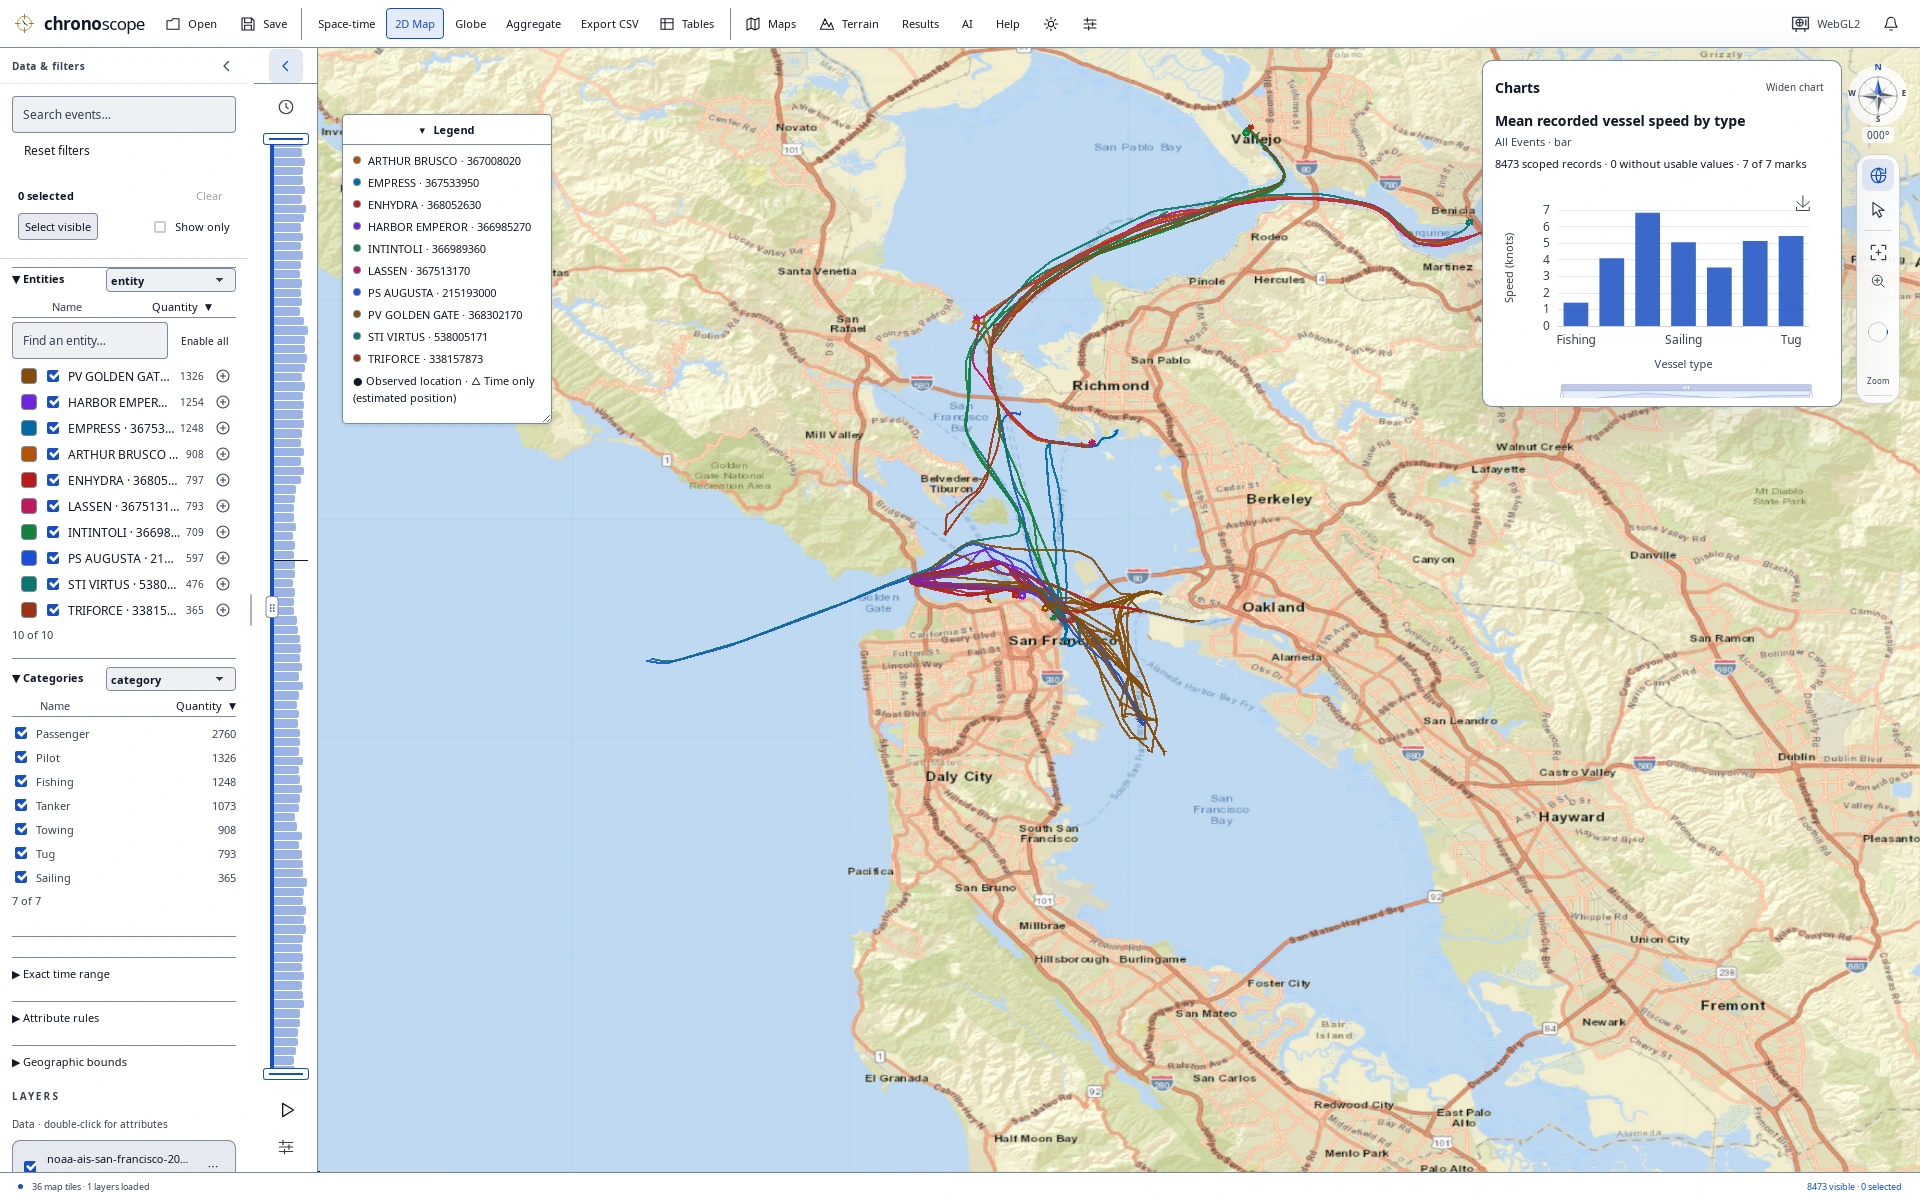
Bay traffic with a compact comparison
Compare vessel types and recorded speeds while keeping Bay traffic and the original records in view.
Bring your own
questions.
Open a bundled demo from Help → Demo datasets, or import CSV, TSV, Excel or GIS files. Filter, select, chart and save a portable .chronoscope project.
Optional SI chat and CLI/MCP tools use the same analysis engine. Online maps and connected services can send information to their providers; see the privacy guide.

Explore the source
Source version 0.15.2, unreleased. No binaries are publicly published in this clean repository yet; build from source.
View on GitHubBehind the views
Application screenshots captured with Chronoscope 0.15.2 on October 22, 2026. Capture source: 915de1c; Native Linux Tauri / WebKitGTK / Cesium WebGL2, software GPU. These are not hardware-performance or cross-platform acceptance tests.
All sixteen images are the exact full-resolution PNGs from the public README, in the selected order. Open any image for its full resolution. Full capture provenance ↗
Data sources, interpretation & map credits
Data sources and interpretation
Storks — pictures 1, 4, 6
6,090 GPS fixes · 3 white storks · July–September 2018.
Three white storks, Europe to North Africa. Vertical height encodes UTC time; the lines connect recorded GPS fixes.
Seals — pictures 12, 54
15,501 dive summaries · 3 northern elephant seals · 2004.
15,501 published dive summaries from three northern elephant seals. Map positions are modeled dive-start locations; depth remains an attribute.
Gulls — pictures 17, 20, 56
15,697 GPS observations · 3 herring gulls · June 2021.
15,697 June 2021 GPS observations of three herring gulls. Stienen et al. / INBO / LifeWatch, CC0. Connected fixes do not establish continuous routes.
**Data:** Stienen et al. (2022). HG_OOSTENDE v4. INBO / LifeWatch / VLIZ. CC0 1.0. doi:10.5281/zenodo.6594838..
Vessels — pictures 23, 24, 27, 57
8,473 AIS observations · 10 vessels · San Francisco Bay, 2024.
8,473 AIS observations, 1 January 2024. NOAA / USCG / BOEM / MarineCadastre. Colors distinguish vessels. Recorded samples, not independent voyages; not for navigation.
Hurricanes — picture 28
3,568 source observations · 83 Atlantic storms · 2016–2025.
3,568 original NHC best-track observations for 83 storms, 2016–2025. Colors help separate storm tracks. Tracks connect reported fixes; maximum sustained wind is in knots.
Earthquakes — picture 35
652 source events · Reported magnitude ≥4.5 · January 2025.
652 USGS-authored earthquakes of reported magnitude ≥4.5, January 2025. Surface epicenters; depth is an attribute. One globe view shows one hemisphere.
Crime — pictures 41, 42
4,053 published reports · Approximate locations · January 2025.
4,053 Police.uk theft-from-the-person reports, January 2025. Locations are anonymized approximations; dates resolve to the month. Picture 41 shows smoothed source-record counts; picture 42 shows counts in display-grid cells at this zoom. These are not population-adjusted risk scores. OGL v3.0.
Map credits
- Pictures 1, 4, 6, 12, 28, 35, 54: Natural Earth II shaded relief and water · public-domain reference artwork.
- Pictures 17, 23, 24: Esri World Imagery · Source: Esri, Vantor, Earthstar Geographics, and the GIS User Community.
- Pictures 20, 27, 41, 42, 56, 57: Esri World Street Map · Sources: Esri, HERE, Garmin, USGS, Intermap, INCREMENT P, NRCan, Esri Japan, METI, Esri China (Hong Kong), Esri Korea, Esri (Thailand), NGCC, (c) OpenStreetMap contributors, and the GIS User Community.
Map credits above are preserved from the capture catalog. Data and map content retain their respective terms; inclusion here is not blanket third-party license clearance. See repository third-party notices, bundled demo sources, and the linked source providers. The Police.uk material contains public sector information licensed under the Open Government Licence v3.0.